Concepts and Practices to Ensure Data Quality


TL;DR:
- Storing and using data is not enough. Data-driven businesses need to trust that their data is healthy and reliable.
- Grouping data quality issues into dimensions, measuring the highest priority dimensions via metrics, and establishing SLAs around your most important metrics, keeps you focused on the data quality issues with the biggest impact.
- Metrics are just numbers unless they’re actionable. Stakeholders need to know how the metrics are relevant to them.
- Good data practices can reduce the frequency of data quality issues and prevent issues that do occur from compounding into bigger problems.
- Proactively protecting and improving data quality protects your team’s time, expands your leverage, and leads to increased trust.
—
Poor data quality can fragment your team’s time, balloon complexity of data infrastructure, and erode trust in data. But it doesn’t stop there. On the organizational level, problems with data quality can cost businesses millions in lost revenue, reduce operational efficiency, and lead to bad business decisions. The risk is especially steep in industries like healthcare that require regulatory compliance.
Unfortunately, fixing data quality isn’t a one-and-done activity. Nor is it just a matter of acknowledging that data quality problems exist. To draw an analogy, data quality isn’t entirely unlike personal, biological health.
While setting out to “get healthy” (have high-quality data) is an admirable goal, without a clear understanding of which qualities you’re looking to change (dimensions), it's difficult to set and meet any meaningful benchmarks (metrics).
Once you get to whatever healthier looks like for you, you need to continue to monitor those qualities, whether it’s blood pressure for your human body or the number of freshness delays for your most critical tables, then compare your numbers against ongoing goals to stay the path. Without metrics, it’s difficult to hold yourself accountable for remediation (SLAs).
So the first step in keeping your data healthy is identifying the most important dimensions, like maximizing the usability of data. The second step is tracking metrics against those dimensions, for example the number of issues flagged by data stakeholders like data scientists or business users. The third step is establishing SLAs on those metrics, such as 24 hour response times to issues.
Only through these three steps can we delay the onset and severity of poor quality data.

Three concepts for reasoning about data quality
Before we get started, we should clarify the distinction between data quality dimensions, data quality metrics, and service level agreements, especially because these terms are used elsewhere in the data ecosystem.
Data quality dimensions are thematic categories of data quality issues. Issues are grouped together by the reason they’re important, such as timeliness, completeness, or accuracy.
Data quality metrics describe specific, quantitative measurements of dimensions. For example, the timeliness dimension might be operationalized by a metric capturing the number of hours that a table refresh was delayed.
Service level agreements are strategic metrics that are tied towards business goals, to which the data team is held accountable. So if the metric is the number of hours that a table refresh was delayed, a SLA could measure the number of delays longer than 12 hours over the past quarter.
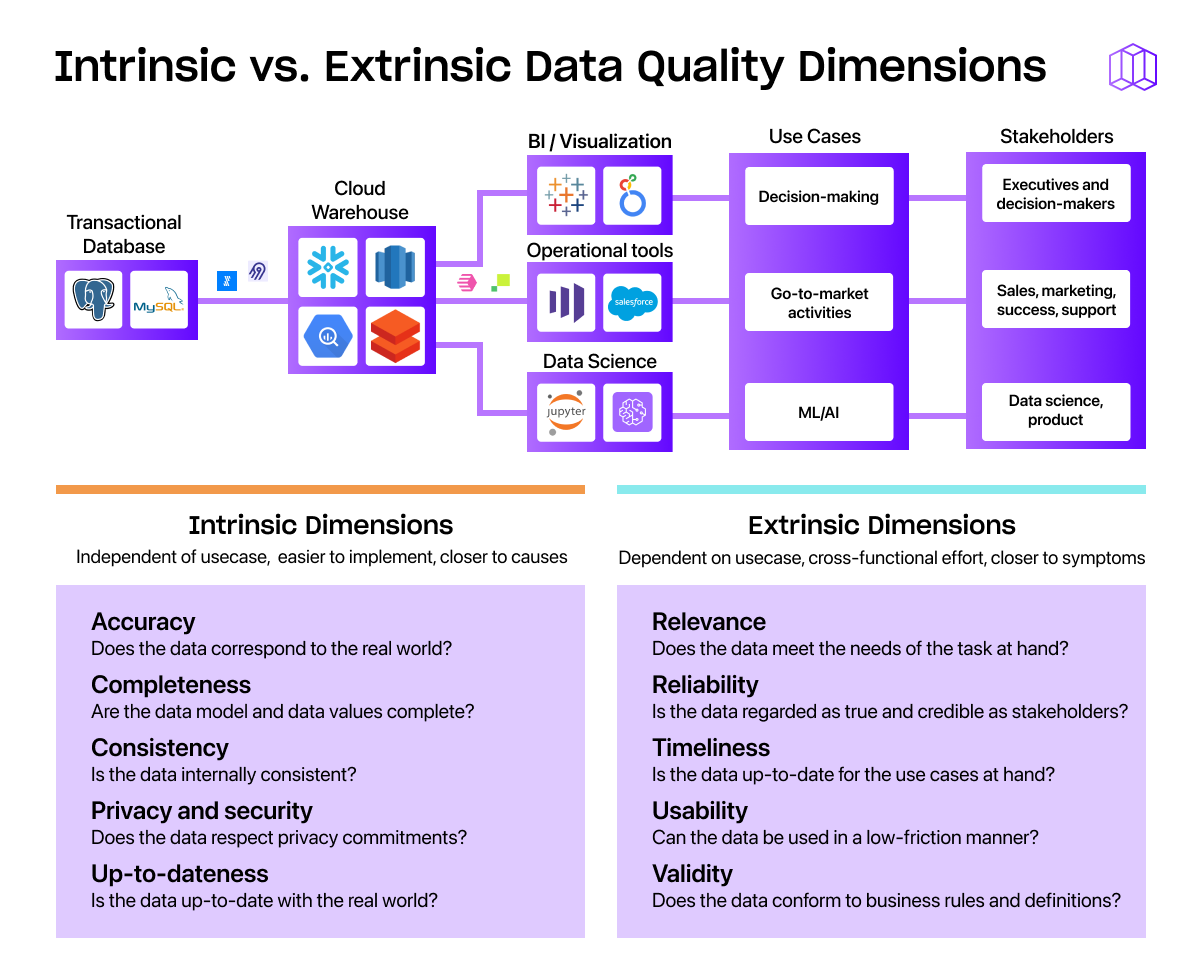
You can further break down these dimensions of data quality into two categories based on whether they’re independent of use case or dependent on how data is used:
- Intrinsic dimensions, which are relevant independent of use case. Examples: data accuracy, data integrity, completeness, consistency, security, and timeliness.
- Extrinsic dimensions, which depend on knowledge of each stakeholder and their use case. Examples: relevance, reliability, usefulness, validity, and availability.
If you want to dive deep into data quality dimensions and metrics, check out this previous blog post. Armed with these concepts, we can jump into two guidelines.
Two guidelines for meaningful data metrics
Hiring data practitioners and protecting their time to focus on value-added work is hard enough. Bouncing from issue to issue implementing different metrics on an ad hoc basis cuts into that already valuable time. Instead, data teams and leaders should take care to ensure they’re focused on clear metrics that tie into the business outcomes that business stakeholders care about and spell out a clear path of action for data producers.
Measure what matters
Before you implement data metrics, you should stop to determine what and why you’re measuring. Most likely, this is going to involve talking with the business stakeholders that use the data your team prepares. Or, you could use metadata like lineage and query logs to quantify what data is used most frequently.
While you could endeavor to establish metrics for every single data use case in your company, you’d probably like to go home, eat, and hang out with your friends and family at some point in the near future.
Instead of trying to boil the ocean, a more feasible start is to focus on the most important and impactful use cases of data at your company today. Identify how data is driving toward business goals, the data assets that serve those goals, and what quality issues affecting those assets get in the way. This means identifying the most common types of data quality issues (dimensions) for your use cases (e.g. relevant, timeliness, etc.). These common pain points point to the dimensions you should prioritize and build data metrics around.
This process makes it easier for you to identify and work on metrics that are the most aligned with business outcomes. You can tackle the most important issues first, and it’s easier to quantify the work the data team is doing to make progress toward high-level outcomes through these metrics.

Once you’ve identified the data quality dimensions you’re measuring on, you can connect those to specific metrics that will help you fix data pain points. For are some examples:
- Let’s say you work at an e-commerce company that sells compostable water bottles. But your data warehouse is suffering from problems with unreliable data (extrinsic dimension) because of inconsistent input data from bottle cap suppliers.
There’s no table recording inventory and sales of the newest product line, and the table for your flagship product line has empty fields where seasonal pricing should go. To measure this dimension, you could establish metrics tracking the degree of validation against complete mapping, the number of null data values in your datasets, the number of satisfied constraints, or the degree of validation against an input mechanism. - Or, you might work at a B2B SaaS company that rents aquariums to offices. Important data use cases might include using sales forecasting based on machine learning for top companies that work in-person, and audience targeting for marketing campaigns for execs and office managers. Ensuring consistency (intrinsic dimension) that the ID primary key in the lead table is unique could be a good metric to monitor.
- Lastly, if you’re at an online pharmacy that sells specialty drugs cost to cost. You probably have concerns about privacy and security (intrinsic dimension) because you handle sensitive PII/PHI, in which case the number of rows containing potentially sensitive information may be a relevant metric.
Note: Your metrics will change over time. As underlying quality issues are resolved, some high-priority metrics may become lower priority. And as the definition of success for the business changes, the data you need to monitor will change with them.
Make metrics actionable
Remember that the data team is neither the creator nor the consumer of company data. We’re the data stewards. While we may think we know the right dimensions to prioritize and the right metrics to track, we need input from our teammates to make sure we’re not wasting our time with extrinsic dimensions that aren’t timely, or intrinsic dimensions that aren’t relevant to use cases.
For example, say we’ve implemented metrics to track consistency in sales data without that many of the sales team’s issues are related to data consistency. In response, we can develop a dashboard of uniqueness of primary keys referential integrity to check if deduplication is needed. But if the dashboard data isn’t connected to the completeness issues faced by the data team, the team won’t understand these numbers or why they’re important to each team’s initiatives.
The data quality metrics we provide should be easy for people to digest, understand, and apply to their jobs. After all, if metrics aren’t actionable, what’s the point of tracking them at all?

To make metrics digestible, you might serve them up in an Objectives and Key Results (OKRs) report as a snapshot of data health. Maybe you make them available in a business intelligence dashboard so teams can track progress on metrics. Maybe you use them to demonstrate how changes at one team’s level affect users downstream.
Or, you could establish SLAs should be an exercise in tandem with the creators and consumers of data. Each dimension and metric will have a different relevant SLA, but the important aspect is that there is a directly responsible team that is held accountable for each.
There are endless ways to quantify and communicate data quality metrics, but the important thing is that you don’t leave stakeholders wondering what the information means and what they should do with it.
Four practices to make a difference in data quality
Once you start establishing data quality metrics to track data quality, you’ll start seeing patterns indicating areas to improve. Remember that metrics are only establishing gauges to track data quality. The goal is preventing and resolving data quality issues so stakeholders can be confident they’re making strategic and operational moves based on reliable, high-quality information.
Just as how you measure data quality depends on the specific issues you encounter, the practices for improving data quality varies on a case-by-case basis depending on the exact metrics and data stack.
But there are general best practices that can help prevent data quality issues from occurring in the first place and help you resolve issues that inevitably do crop up before they snowball into major problems.
Prevent the issues can that can be prevented
As data teams mature and data gets used across the business, it’s natural for the number of data assets to grow. As a result, it’s easier and easier for data quality issues to occur and for low quality data to slip through undetected. Brainstorm business processes you could enact to beef up your data defenses.
Periodic data quality assessments and OKRs around quality can help you flag data issues while they’re still in their early stages and neutralize them before they cause downstream harm.
Enlist the help of other teams to reduce accuracy and validity errors caused by data entry mistakes. In addition to encouraging data-entry training, provide option sets where possible to prevent confusion over things like state abbreviations (is Michigan abbreviated “Mich.” or “MI”?) from causing data cleansing headaches down the line.
If you’re pulling in data from third-party sources, make sure your company enforces tracking plans to improve the quality of the data coming in. You can create metrics specifically designed to catch inbound data issues, such as how many (and how often) constraints are satisfied, degrees of validation against a complete mapping, and more.
Invest in data infrastructure tooling that encourages data quality
The modern data stack makes it easier than ever to monitor your data quality all the way from data sources to consumption. From product analytics tools like Segment Protocols, Avo, and Iteratively to ELT solutions like Fivetran and Airbyte to reverse ETL solutions like Census and Hightouch, there are a suite of resources available to help you ensure your data is reliable, up to date, and federated correctly.
And, of course, there are some great data observability options out there to incorporate into your data quality management processes to help you detect, investigate, and debug any data issues that may arrive before they meaningfully impact your goals.

Check metrics deeply and often
People who care about their health don’t go to the doctor for a checkup once and never return. They go on a regular schedule for tests and screenings that let them know what health improvements they need to make now and what they need to keep an eye on for later. Data profiling cannot be a one time action.
We know we’re preaching to the choir here, but data health requires the same vigilance. When you regularly examine your incoming and outgoing data, you can spot any corrective actions you need to take or any red flags you need to watch before they cause a crisis. In addition, you can find insights into ways the business can drive improvements or become more competitive.
Align data quality with stakeholder impact
To people outside the data team, “data quality metrics” may sound like a foreign language. If data quality is going to be an important piece of your corporate culture, you need to make it relatable and prove that data is trustworthy.
Measure the impact of data quality improvements and regularly communicate it in language other teams can understand. For example, let’s say a 10% improvement in customer data quality allows customer success teams to resolve complaints faster, leading to a 5% increase in customer retention.
Share that 5% improvement far and wide, and connect it back to improvements in data quality. Even people who don’t understand the data quality metric can understand the value in keeping customers.
Reporting on metrics your coworkers outside the data team care about and demonstrating how they are tied back to data quality leads to improved understanding of where data comes from and builds trust that the data is right.

Arm your data team with data quality tools
In a data-driven world, trustable data is critical to business success. As stewards of company data, the data team plays a crucial role in helping business teams reach company goals.
But we can’t make bricks without clay. Data quality is an important factor in lowering the risk of data-based decisions. Metrics are a safeguard against basing decision-making on low-quality data. What’s more, they offer business teams a window into the work of the data team and confidence in the insights the data implies.
While your data team is no doubt filled with talented, technical individuals capable of hunting down every data problem that comes their way, they can move the needle on data metrics faster with the right quiver of data governance tools at their disposal, including data observability tooling.
While the Metaplane team is dedicated to building the Datadog of data tools, I’m always happy to talk with data leaders about any way they can better empower the data team to drive value (even if you’re not a customer). Feel free to reach out and say hi.
Table of contents
- TL;DR:
- Three concepts for reasoning about data quality
- Two guidelines for meaningful data metrics
- Four practices to make a difference in data quality
- Arm your data team with data quality tools
Tags


...


...