

What is data freshness? Definition, examples, and best practices
Learn what data freshness is, why it matters, and how to keep the data in your pipeline up-to-date.

If you care about whether your business succeeds or fails, you should care about data freshness. Fresh data is important because it has a huge impact on your bottom line. Unfortunately, that impact often goes undetected—until it’s too late.
Say your business uses data for operational purposes, and your data is stale, you could inadvertently send a discount code to a cohort of customers who already purchased your solution, inviting them to demand the same deal terms, costing you thousands of dollars.
If your business uses data for decision-making purposes, on the other hand, and your data is stale, you could underreport your return on ad spend, causing you to withdraw an investment that is actually paying dividends in reality.
Now that you know why data freshness matters, let’s dive into exactly what it means. In this blog post, you’ll find a definition, examples, and four methods for measuring data freshness.
What is data freshness?
Data freshness, sometimes called data up-to-dateness, is one of ten dimensions of data quality. Data is considered fresh if it describes the real world right now. Frequent data collection is crucial for maintaining data freshness, as it ensures that the information remains up-to-date and reliable. This data quality dimension is closely related to the timeliness of the data but is compared against the present moment, rather than the time of a task.
While often used interchangeably with related terms, data freshness has some important distinctions:
- Data freshness: How well data represents the current state of reality
- Data timeliness: Whether data is available when needed for a specific task
- Data recency: How recently data was collected or updated
- Data latency: The delay between data creation and availability for use
Data freshness exists on a spectrum based on use case requirements:
Why is data freshness important?
Data freshness is crucial for businesses to make informed decisions, stay competitive, and deliver exceptional customer experiences. Fresh data enables organizations to respond promptly to changing market conditions, customer needs, and operational requirements. Without up-to-date data, businesses risk making decisions based on stale information, leading to missed opportunities, misallocated resources, and potentially costly consequences. Data freshness is essential for maintaining data quality, ensuring that insights are accurate, and decision-making processes are reliable.
Like everything in data, freshness is about context
If you've been in data long enough, you know the answer to most complex questions is "it depends." This holds especially true for data freshness.
Use case dependency
The acceptable freshness window for data varies dramatically depending on how you're using it.
- Fraud detection: Needs real-time transaction data (seconds)
- Customer segmentation: Daily updates may be sufficient
- Quarterly business reviews: Weekly refreshes might be acceptable
A data asset can be simultaneously "fresh" for one use case and "stale" for another, so freshness is always going to have a different definition depending on the business context.
SLA considerations
Establishing clear Service Level Agreements (SLAs) will help you define data freshness on a given project. Acting as your source of truth, you can set parameters around:
- Refresh frequency: How often data should be updated
- Lag tolerance: Maximum acceptable delay between event occurrence and data availability
- Availability window: When fresh data must be available (e.g., "before 9 AM daily")
An effective SLA doesn't just state the technical requirements; it ties them directly to business impact.
Stakeholder alignment
The most successful data teams don't dictate freshness requirements–they collaborate with stakeholders to establish them.
Get clear answers from business users about how quickly they need to react to changes in the data, what decisions are made using the data, and what the cost of making decisions with outdated information might be.
How do you measure data freshness?
To test any data quality dimension, you must measure, track, and assess a relevant data quality metric. In the case of data freshness, you can measure the difference between latest timestamps against the present moment, the difference between a destination and a source system, verification against an expected rate of change, or corroboration against other pieces of data. These metrics help organizations assess the freshness of their data and identify areas for improvement.
Key metrics for data freshness
To measure data freshness, organizations can use various metrics, including:
- Data age: This metric measures the time elapsed since the data was last updated or collected. It helps organizations understand how current their data is.
- Data recency: This refers to the frequency at which data is updated or collected. Regular updates ensure that the data remains relevant and timely.
- Data timeliness: This metric assesses the time it takes for data to be made available after an event occurs. Faster availability means fresher data.
- Data relevance: This measures the degree to which data is pertinent to the current situation or decision-making process. Relevant data is more likely to be fresh and useful.
- Data accuracy: Accurate data is free from errors and reflects the true state of affairs. Inaccurate data can mislead decision-making.
- Data completeness: This metric evaluates whether all necessary data is present. Incomplete data can lead to incorrect conclusions.
- Data consistency: Consistent data is uniform across different sources and systems, ensuring reliability and trustworthiness.
Data freshness metrics are essential indicators that help organizations evaluate the recency and timeliness of their data, ensuring that insights are grounded in the most relevant and accurate information.
4 methods for measuring fresh data
You can't manage what you don't measure. And when it comes to data freshness, having the right measurement approach can be the difference between catching issues early and explaining to stakeholders why their dashboards show yesterday's reality. Let's dive into four battle-tested methods that every data team should have in their toolkit.
1. Timestamp differential analysis: The classic approach
The bread-and-butter of freshness monitoring—comparing the most recent timestamp in your data with the current time.
Think of this as the "pulse check" for your data assets. It answers the fundamental question: "How long has it been since this data was last updated?"
```sql
-- Basic freshness check you can implement today
SELECT
table_name,
TIMESTAMPDIFF(HOUR, MAX(last_updated), CURRENT_TIMESTAMP()) as hours_since_update,
CASE
WHEN TIMESTAMPDIFF(HOUR, MAX(last_updated), CURRENT_TIMESTAMP()) > 24
THEN 'STALE' ELSE 'FRESH'
END as freshness_status
FROM your_table
GROUP BY table_name;
```
This approach shines for operational tables that should be constantly updating. When your orders table hasn't seen a new record in three hours during peak business hours, you've got a problem that needs immediate attention.
Not all tables have obvious timestamp columns. Look for `created_at`, `updated_at`, `etl_inserted_at`, or even transaction dates that can serve as proxies.
This is a helpful approach for any tables with reliable timestamp columns that update with data changes. It's particularly valuable for high-velocity tables where freshness is critical.
2. Source-to-destination lag: Mind the gap
Source-to-destination lag measures the delay between when data appears in source systems versus when it lands in your data warehouse.
This method focuses on the journey, not just the destination. Instead of asking "Is my data fresh?" it asks "How long did it take my data to get here?"
How to implement in practice:
- Create checksum comparisons between source and target systems
- Track record counts across the pipeline to spot bottlenecks
- Deploy "canary" records (test records with known timestamps) to measure end-to-end latency
- Use this SQL pattern to spot growing lags:
```sql
-- Source to destination lag tracking
SELECT
source_system,
AVG(TIMESTAMPDIFF(MINUTE, source_event_time, warehouse_insert_time)) as avg_lag_minutes,
MAX(TIMESTAMPDIFF(MINUTE, source_event_time, warehouse_insert_time)) as max_lag_minutes
FROM pipeline_metrics
GROUP BY source_system
ORDER BY max_lag_minutes DESC;
```
When marketing needs to know why their campaign dashboard isn't reflecting this morning's ad spend, this method helps you pinpoint exactly where the delay is happening—in the source API, the data pipeline, or the transformation layer.
Keep in mind though that you need instrumentation at both ends of the pipeline. If you're just starting out, focus on adding event timestamps at critical points in your data flow.
This is particularly helpful for complex ETL/ELT pipelines—especially those with multiple hops or transformations between source and final destination.
3. Expected change rate verification: Pattern recognition
The detective work of freshness monitoring—learning the normal rhythm of your data updates and flagging when that pattern breaks.
Some tables update every minute. Others update daily at 3 AM. Understanding and monitoring these patterns is key to spotting freshness issues before users do.
Practical implementation steps:
- Analyze historical metadata to establish expected update patterns for key tables
- Create time-based profiles (hourly, daily, weekly patterns)
- Set dynamic thresholds that adapt to these patterns
- Alert when reality deviates from expected patterns
When your finance team's month-end close process depends on data that should load by 6 AM, this method helps you proactively alert them if the pattern breaks—before they start building reports on incomplete data.
Try this for business-critical systems with predictable cadences, like nightly batch jobs, recurring API syncs, or regular business processes (daily sales, monthly financial loads, etc.).
4. Cross-dataset corroboration: Connecting the dots
This approach uses relationships between datasets as a canary in the coal mine for freshness issues. When datasets that normally move together suddenly diverge, something's probably wrong with one of them.
Smart implementation approaches:
- Identify metrics that should have consistent ratios across related tables
- Monitor parent-child relationships (e.g., orders and order_items should update together)
- Track derived metrics across original and aggregated tables
- Set up anomaly detection for unexpected divergence in related patterns
When your orders table shows 1,000 new transactions today, but your `order_items` table only shows 100 new items, you know something's wrong with the freshness of one of those tables—even without checking timestamps.
Use this approach for complex data ecosystems with many interdependent datasets, especially when direct timestamps are unreliable or unavailable.
Remember, the strongest data freshness strategy uses multiple measurement approaches. Different methods catch different types of issues, and what works for one dataset might not work for another. The goal isn't perfect freshness for everything (that's both impractical and unnecessary), but rather matching your freshness monitoring to your actual business needs.
What are some examples of stale data?
Imagine that you’re part of the data team, specifically part of the data engineering team, which includes creating data pipelines for downstream stakeholders. Just as an example, we’ll be using a common use case of pulling data from the Google Ads and Google Analytics APIs into your data warehouse as part of your core data sources being used to define marketing attribution. While some use cases may require constant data processing to achieve real-time decisions; if we’re looking for marketing attribution, a common minimum acceptable cadence for data refreshes can be safely set at daily updates - any refresh cadence beyond that would be considered "stale" data.
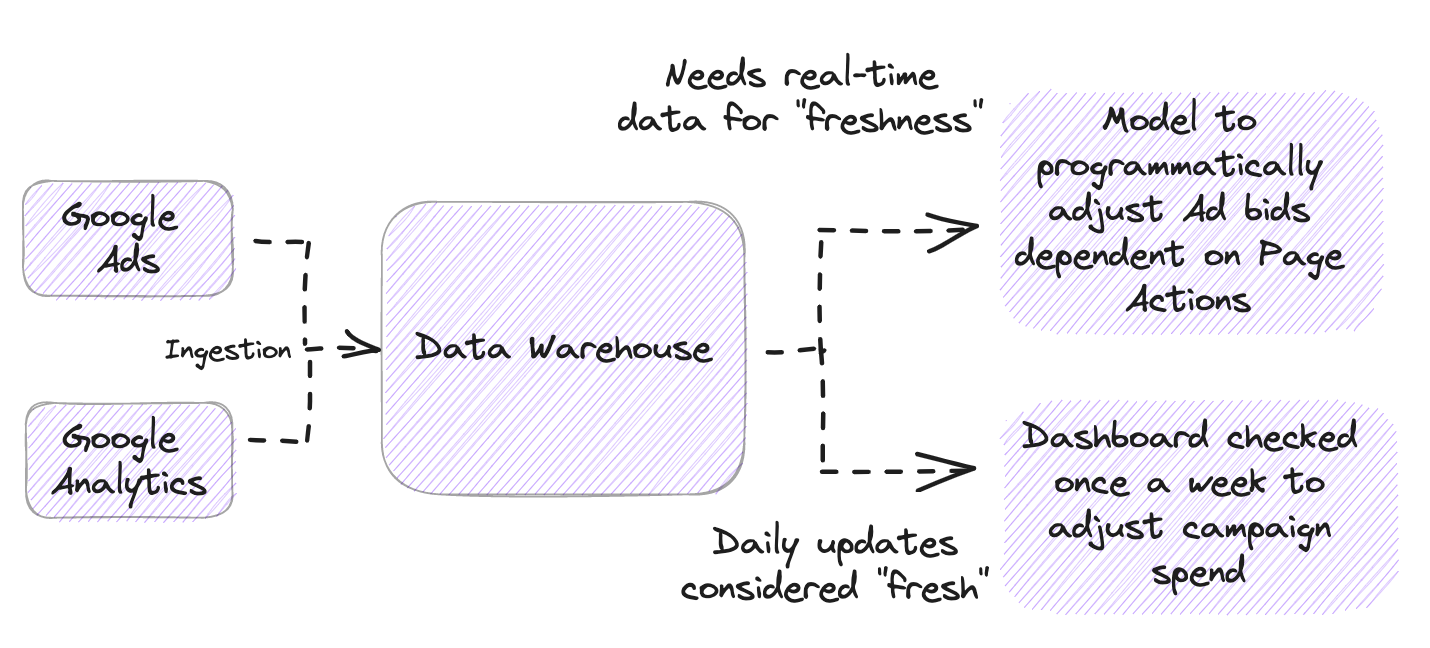
The above is one way that the definition of “stale data” can change dependent on your internal data management agreements with other stakeholders. Continuing with the example, if your team shifts from ad-hoc SQL queries to adopting dbt to chain together schema and model dependencies in the pursuit of speed, your once acceptable daily updates slip quickly into being considered as “stale data”.
How to ensure data freshness
One way to ensure data freshness is through anomaly detection, sometimes called outlier analysis, which helps you to identify unexpected values or events in a data set. Data Observability tools include anomaly detection as part of the core functionality, and can find not only data freshness, but also other dimensions such as completeness or consistency, for you to scale data quality measures across your data warehouse.
Using the example of a stale number of products sold, anomaly detection software would notify you instantly if the frequency at which the table was updated was outside of the normal range. The software knows it’s an outlier because its machine learning model learns from your historical metadata.
Here’s how anomaly detection helps Andrew Mackenzie, Business Intelligence Architect at Appcues, perform his role:
“The important thing is that when things break, I know immediately—and I can usually fix them before any of my stakeholders find out.”
In other words, you can say goodbye to the dreaded WTF message from your stakeholders. In that way, automated, real-time anomaly detection is like a friend who has always got your back.
Final thoughts
Data freshness isn't just a technical concern—it's a business imperative with direct impact on decision quality, operational efficiency, and customer experience.
By implementing the strategies outlined in this guide, you'll be well-positioned to:
- Define clear freshness requirements based on business needs
- Implement robust monitoring to catch issues early
- Build resilient pipelines designed for optimal freshness
- Create a culture where freshness is a priority
Remember: The goal isn't perfect freshness for everything (that's impractical and unnecessary). Instead, focus on delivering the right freshness for each use case.
To take anomaly detection for a spin and put an end to poor data quality, sign up for Metaplane’s free-forever plan or test our most advanced features with a 14-day free trial. Implementation takes under 30 minutes.
Editor's note: This post was originally published in May 2023 and updated for quality and freshness (pun intended) in February 2025.
Table of contents
Tags


...


...


