The Data Observability Playbook: Best Practices for Data Engineers

You already know data observability would benefit your company. After all, your team uses data to fuel company operations and power strategic decision-making. Plus, your team is overwhelmed by the number of messages they receive from key stakeholders, alerting them to data quality issues that could have been prevented.
What you don’t know is what tool you should invest in and how to set it up, both in the short- and long-term. If that hits home, this guide was made for you. Below you’ll find best practices for buying, implementing, and growing with your data observability tool.
Before you buy
Every company and team has unique needs and goals. As a data leader, it’s your job to take those needs and goals into consideration when evaluating technology vendors.
In this section, we outline all the questions you should answer before pulling the trigger on a purchase.
What are your goals?
The first question to ask yourself is, “What am I trying to achieve with this investment?”
Maybe you want to earn stakeholder trust with improved data quality. Maybe you want to reduce the frequency and severity of data incidents that pull your team away from higher-value priorities, saving valuable engineering hours and maximizing the productivity of your team. Maybe you want to expand your team’s awareness of the state of your data with a centralized metadata repository. These are all valid goals that data teams use data observability platforms to achieve.
Once you’ve identified your goals, attach quantitative or qualitative metrics to them and set a regular cadence for tracking your progress. Doing so will help you evaluate and demonstrate the success of your initiative.
What are your needs?
The second question to ask yourself is, “What requirements must be met for this initiative to be successful?”
The most obvious answer is that the vendor you choose should integrate with key tools in your data stack—your data warehouse, transformation tool, and business intelligence platform at minimum. This is important because you need end-to-end visibility into your data pipeline to detect, investigate, and resolve data incidents. It’s not enough to plug in your warehouse alone. You should also consider the amount of friction the tool would add or remove from your current processes. If your team lives in Slack, for example, you’ll want to invest in a tool that alerts you there. The more the tool fits into your current workflow, the more likely your team will adopt it.
One final consideration is how many resources you can dedicate to this initiative. If your team is already operating at or above capacity, you might want to invest in an agency that provides a managed solution. On the other hand, if you have an hour to spare this week and want to complete the setup right away, you might prefer a self-serve tool you can implement in under 30 minutes. If you have considerable resources and want a sales professional to walk you through the purchasing process, you might prefer an enterprise tool, which often takes at least a quarter to implement.
What are your use cases?
The third question to ask yourself is, “In what situations could a data observability platform be useful?”
Start by thinking about the kinds of issues your team has faced, how you currently solve them, and where you could use the most help. If you need help identifying data quality issues, for example, you could use anomaly detection. If you need help investigating data incidents through root cause and impact analyses, you could use usage analytics and lineage features. If you need help managing what you spend across your data stack, spend monitoring features would be most helpful. These are just a few of the ways that data observability helps data teams deliver on their mandate.
During implementation
After you create a free account and connect your data sources, Metaplane’s machine learning model will start learning from your historical metadata. You’ll receive your first alerts within one week. From that point forward, the implementation process can be divided into three easy stages: establishing a baseline of tests, configuring the tool to suit your company’s needs, and adding advanced tests on your most vital data assets. Along the way, we make ourselves available to answer any of your questions, refine your setup, and ensure you’re not overalerted.
Establish a baseline
Marion Pavillet, Senior Analytics Engineer at Mux, is famous for urging her peers to not boil the ocean. In other words, when you’re first getting started, start small. Work backwards from your goals, needs, and use cases to determine what features you need now, and worry about the rest later. This will help you understand how the technology works and how your organization responds to the technology.
Say you want to prioritize increasing your team’s productivity. Features like anomaly detection, usage analytics, and lineage are important because they empower data engineers to quickly detect, investigate, and resolve data quality issues. Metaplane customers like Vendr and Mux save an average of eight hours per week thanks to these features.
A good next step is to blanket your warehouse with freshness and volume tests, which help you catch common data quality issues as they occur. Volume, or row count, tests help you catch data completeness, consistency, and accuracy anomalies—data that has been incorrectly replicated from a data source to your warehouse, for example. Freshness tests help you catch data freshness, or currency, anomalies, such as stale data resulting from delayed Fivetran or Stitch jobs or broken dbt models that fail to run.
Configure the tool
Every business is different, and every data environment is unique. Therefore, you must shape data observability around the needs of your company and team—not the other way around.
Metaplane offers smart default settings that allow you to get off the ground quickly. However, we also offer the ability to configure anything that matters. Specifically, you’re able to customize your test frequency, manual thresholds, and alert sensitivity. Plus, you have the option to write custom SQL tests.
Regarding test frequency, tests run every hour by default. However, you can create a custom schedule that’s aligned with how often your data is updated from the source. This is important because it helps you catch data quality issues right away, before they have a chance to cascade and compound. As an example, if your data updates daily, you probably don’t need to test hourly, but if your data is updated and used in real-time, you may decide to run tests every five minutes.
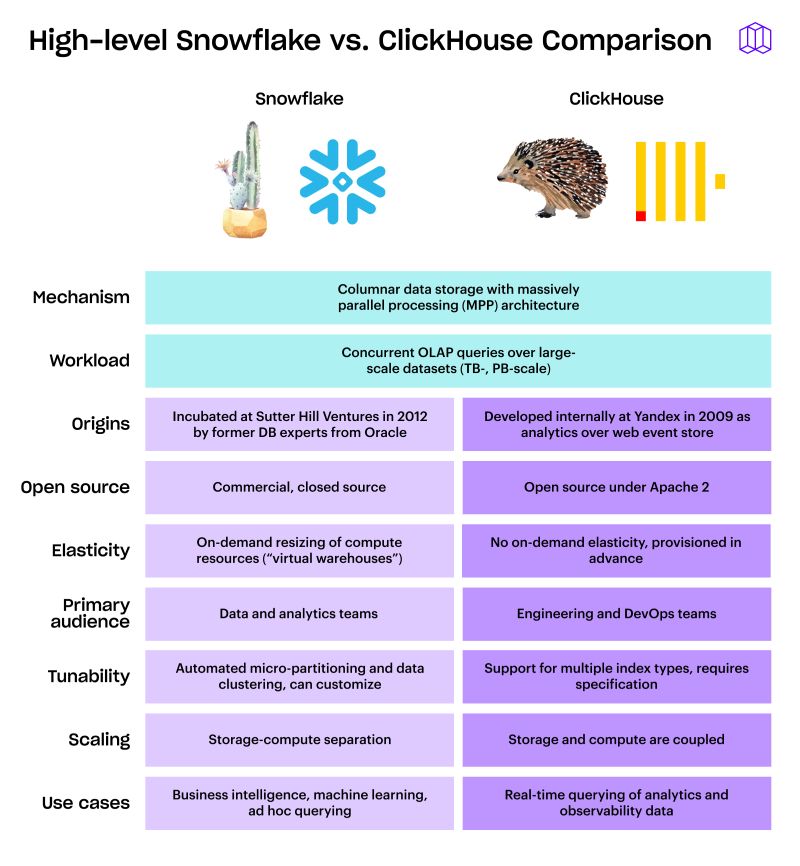
If you use tools with credit spend models, like Snowflake, keep in mind that there’s a tradeoff between test frequency and cost. In other words, testing every five minutes will cost you more than testing every hour. As a result, you may want to scale your testing frequency up or down based on your financial resources.
Our machine learning model creates automatic thresholds for you based on your historical metadata. However, you do have the ability to set manual thresholds, if needed. Manual thresholds instruct Metaplane to alert you when a value is above or below a specific value. The most common situation in which manual thresholds are needed is when a data team is bound by a service-level agreement (SLA).
Another way you can customize your setup is to select your alert sensitivity. Metaplane categorizes alerts based on the degree to which a value falls outside its expected range and the degree of impact that incident has on downstream assets. By default, alerts are sent for “failures.” However, if you only want to be alerted to the largest deviations and most impactful incidents, you can change the setting to “critical failures.” On the flip side, if you want to be alerted to any change that occurs, you can choose “warnings” as your setting.
Add advanced tests
Once you’ve had a chance to explore your most critical data assets in the platform, it’s a good time to add advanced tests. Here’s a list of some of the advanced tests you can add:
- Distribution, which tracks five categories of summary statistics: center (mean, median), extent (min, max, range), cut points (upper 75th percentile, lower 25th percentile), spread (standard deviation, interquartile range), and distribution (skew, kurtosis). These tests catch incorrect data entry and typos, bugs introduced into upstream product databases, and transformation logic that incorrectly manipulates or casts data.
- Cardinality, which tracks the number of unique values in a column. These tests catch misspelled values, different capitalization or words, or new values that fail an acceptable values test.
- Uniqueness, which tracks the uniqueness of a column as defined as (# unique values / # total values) and ranges from 0 to 1. These tests catch non-unique primary keys, duplicate data, and data drift.
- Nullness, which tracks the nullness of a column defined as (# null values / # total values) and ranges from 0 to 1. These tests catch transformation bugs that fail to successfully join data, upstream product bugs that cause data to be missing, and ETL syncs that miss data.
- Column counts, which tracks the number of columns in a table or view. These tests catch removed columns, changes in semi-structured data, and unanticipated schema changes.
- Sortedness, which tracks the sortedness of a column, calculated as the percentage of pairs of consecutive values that are increasing from the first value to the second value, ranging from 0 (fully descending) to 0.5 (random order) to 1 (fully ascending).
Our highest-performing customers have a mix of both basic and advanced tests. A good rule of thumb is to go deep on your most important assets and broad on the rest. The thing is, data issues don’t occur in a silo. Data is intimately connected through lineage relationships, and by the time an incident occurs in your most important tables, the damage might already be done. Ideally, you catch issues upstream in staging or pipeline environments. Having those tests upstream helps prevent downstream impact.
If the available tests don’t meet your needs, you can always set up a custom SQL test. It’s important to note that we track custom SQL tests like any other, sending you alerts whenever a value deviates from the norm. One case when you’d want to use a custom SQL test is if you need to make sure that the same metric reported by two different teams are identical. For example, your growth and marketing teams want to track how many unique visitors come to the website, but they extract this data from two different sources.
Following setup
Immediately after you implement Metaplane, the product will start collecting your historical metadata. After a week or so, you can start to explore how your data behaves—how it trends over time, changes with the seasons, and correlates with each other. With features ranging from anomaly detection to lineage and usage analytics, you can also quickly identify, investigate, and resolve data quality issues, reducing both your time-to-detection and time-to-resolution.
Below, you’ll find three post-implementation best practices.
Put processes in place
Tools don’t solve problems, people solve problems. The most tools can do is help people make better decisions and perform better actions. When those decisions and actions are tied to long-term goals and deliberately practiced on a repeated basis, you’ve created a process. And processes are important if you want to drive consistent results and alignment around goals.
One example of a process built around data observability comes from Metaplane customer Daniel Wolchonok, who’s the Head of Data at Reforge. He has crafted a rotating schedule for when employees are responsible for monitoring alerts. This allows the team to avoid duplicating efforts, staying focused on other priorities until it’s their turn.
A second example comes from Metaplane customers Erik Edelmann, the Head of BI and Analytics Engineering at Vendr. He designates one day per week for “clean up”: deprecating models that go unused and refactoring models that require better hygiene.
Give the model feedback
No model is perfect, and no one knows your business as well as you do. That’s why we’ve made our alerts interactive, allowing you to provide feedback that improves the model while effectively reducing alert fatigue. Giving feedback is important because data is dynamic. As it changes over time, the model will automatically adjust based on your feedback.
If you don’t provide feedback, the model will still learn eventually. But if you do provide feedback, it learns faster and becomes more tailored to your organization. You also have the option to reset a model for a specific test, if you ever need to. One scenario in which this would be relevant is if your data went through a dramatic but expected change, and you wanted to refresh the model as a result.
Expand your use cases
As your business grows, the number and type of use cases your data serves will grow with it. Perhaps you started with our anomaly detection feature to grow your awareness of data quality issues, then responded to your newfound knowledge with an investigation of those incidents via our lineage and usage analytics features. In the future, you may want to integrate credit spend monitoring into your workflow. As the amount of data and number of use cases warrants more awareness of costs, the usage analytics feature can also be helpful in directing your refactoring and deprecating efforts.
Ready to get started? Sign up for Metaplane’s free-forever plan, or test our most advanced features with a 14-day free trial. Implementation takes under 30 minutes.
Table of contents
Tags
...

...


