Data Observability vs. Software Observability
For a concept that no one can quite define, observability is hot. First it spread from its roots in control theory to software systems, and now it’s spreading again to data systems. This article is for data practitioners with an interest in engineering, as well as for software engineers with an interest in data.

What is Software Observability?
Ask the closest software engineer if they remember what building software was like before tools like Datadog, AppDynamics, New Relic, Grafana, Splunk, and Sumo Logic. It was painful. As children of the cloud, these software observability tools rose from the foundation laid by Amazon Web Services and the cloud services to come. The premise was simple: when you host components of infrastructure like databases, servers, and API endpoints in the cloud, you should know the state of them, whether it's the memory usage of a database, the CPU usage of a server or the latency of an API endpoint. As you have more and more infrastructure, the need to monitor it becomes more and more critical.
That’s why the term “observability” was borrowed from control theory, where observability “is a measure of how well internal states of a system can be inferred from knowledge of its external outputs.” The thought is that, by measuring enough pieces of the information of your system over time, its internal state can be inferred over time.
Software observability tools gave every engineering team the ability to easily collect metrics over time across their systems, giving them instant insight into the health of these systems. But the companies that separated themselves from the rest were those that built incredible developer experiences. Engineers need to be able to easily add monitoring agents within their systems to collect metrics, traces, and logs. Once you are collecting this metadata, is it easy to make them actionable? Tools like those we’ve mentioned make it simple to create dashboards containing the most critical metrics, allowing you to add alerting and anomaly detection, and easily send notifications to Slack and Pagerduty to notify your team when something goes wrong.
The best tools didn’t stop there. They added another integrated layer: application performance monitoring (APM). It’s not enough to know that an API endpoint is slow; an engineer needs to be able to have context to understand why that endpoint is slow so they can fix the underlying issue. Traces coupled with an easy to use interface makes it simple for an engineer to conclude that their APIs are slow because of a specific Postgres query that needs an index.
In hindsight, it makes sense why software observability tools have taken off. Software engineers can’t imagine their lives without a centralized view across their systems, and they are ingrained in every part of the engineering process. You can’t effectively refactor a system to improve performance without first understanding its baseline performance. You can’t effectively scale your cloud capacity without first understanding where the bottlenecks exist. You can’t easily debug your entire system in minutes without an integrated, end-to-end view of each part of the system, when metrics were last reported and how they are trending, how messages are passed from system to system, and what each system’s logs contain.
These software observability tools have transformed the world of software from a convoluted, low-information environment eschewing any effort to gain a closer look to a highly-visible, some might say observable environment. In the 2020s, spinning up infrastructure without Observability seems unthinkable. As new architectures like microservices and distributed systems achieve major adoption, the importance of visibility across all assets is increasingly important.
What made Software Observability possible? Three things:
- Technological shift: Technologies made it cheap to store huge amounts of metadata that was otherwise cheap to retrieve and transmit.
- Increasing need: Ballooning infrastructure surface area leads to more dependencies between components and opportunities for breakage.
- Organizational friction: Separation between engineers who write code and IT professionals who deploy code.

What is Data Observability?
Now, ask your closest data person (their job data might be data engineer, analytics engineer, data analyst, etc) whether they know if the data products they support (dashboards, reverse ETL tools, extracts, etc) have trusted, timely, high quality data. After talking to hundreds of data leaders, we’ve learned that the answer to this question is often “not as much as I need to.”
This used to not be a big problem. The central vein of data within companies used to be business intelligence dashboards for decision makers. But that vein has split off into many different data products. As data becomes a product spanning several use cases in one company, the surface area of data systems that can break continues to expand. Sounds familiar, right?
The emerging category of data observability tools proposes to solve this family of jobs: monitoring whether a data issue has occurred, analyzing the downstream impact to help prioritize, and providing the context needed to debug.
What made Data Observability possible?
- Technological shift: Massively parallel processing (MPP) databases, API maturity in ecosystem.
- Increasing need: Ballooning data surface area leading to increased maintenance overhead and opportunities for breakage.
- Organizational friction: Differing expectations about data quality between those who create data and those who consume data.
How is Data Observability similar to Software Observability?
Aside from both being areas of major growth, there are deep similarities between the two fields that warrant the analogy.
Issues compound over time: In both software and data systems, every second of downtime matters because issues are rarely self-healing and often compound over time. Outages in software components can have cascading effects that impact other pieces of the system, all of which rolls up into a degraded experience for users. Outages in data systems result in a similar degraded experience, with the added consequence that missing data can often never be retrieved again.
Issues are disruptive: As different as software and data teams can be (though we believe in the mission to bring them closer), the nature of the work requires stretches of focused time. As a result, issues not only cost time to fix and remediate, but also can fragment entire stretches of otherwise productive time.
Contracts: Software and data both exist in order to be used for a purpose. Within that usage is either an explicit contract for a certain degree of performance, often in the form of service level agreements (SLAs), or an implicit contract that systems should be working.
Using historical data to identify present issues: At the core of software observability tools is the capability to collect, store, and analyze system behavior over time. For example, an engineering team could use SignalFx to track CPU utilization across all compute resources over time. The purpose is three-fold: first, this historical data can be used to establish baseline performance; second, it can be used to help identify incidents in real-time through rules or anomaly detection; third, it can be used to report performance over time.
Ideal state: At the end of the observability rainbows lie two similar dreams: reliable systems that 1) prevent issues from occurring at the source and 2) self-heal when issues do occur. Unfortunately, both perfect code quality and perfect data reliability are unattainable goals.

How is Data Observability different from Software Observability?
Data is like food service. As data leader Gordon Wong says, assuring the safety of food is an effort all the way from the people sourcing food, to those who prepare it, to those who serve it. If something goes wrong, patrons might not find out immediately. When they do, it’s a complex process to debug the root cause, and trust in the restaurant may be permanently damaged.
In contrast, software is like traffic control. Imagine if all of the traffic lights in New York City blacked out. There would be immediate havoc. The problem could have multiple root causes, whether it’s a logical error or an electrical grid issue, which itself could have many causes. But once the traffic lights are fixed, it’s a matter of time until everyone gets home safely and, unless this happens again and again, they’ll probably keep driving.
Needless to say, data observability is centered on data, which has weight (it takes time and resources to move), structure (different pieces cannot be swapped out like they’re interchangeable), history (you cannot press the “reset” button). In contrast, Software Observability is centered on software systems, which have minimal marginal cost of replication, interchangeable (remember the saying to treat your software like cattle not pets), and increasingly ephemeral. While general, these differences have major implications.
Different pillars: The three pillars of software observability, according to Datadog, are metrics, traces, and logs. The four pillars of data observability in contrast are metrics, metadata, lineage, and logs.
Root cause analysis: Because of the nature of the data lifecycle from collection of raw data to transformation to consumption, identifying the root cause of data issues is often a matter of tracing direct dependencies, also called the lineage or provenance of data. At the highest level, this lineage can be mapped between tables, though finer levels of granularity like lineage between columns or even between values is preferred. Ironically, even though data has lineage in theory, collecting and storing this lineage in practice can be extremely difficult as it crosses between systems, is combined and transformed, and involves both code and data (though orchestration tools like dbt, Prefect, and Dagster make it significantly easier).
In contrast, while root cause analysis in software systems can be equally frustrating, there is frequently a clear dependency between system components, and the logic within and between these systems is dictated by version-controlled code.
Downstream impact. With software observability, it’s usually machine to machine until you get to the application itself, which impacts a specific subset of people: your customers. It’s simpler to understand the impact of something going down: it affects customers and there are standard tools and processes to use when things go wrong: add a message to your status page, ship the fix, and the product continues to work for your customers. For example, if your Postgres has increased latency, it affects our API response time, which affects the web application experience for customers. So, we add a note to our status page explaining the latency, increase the caching layer to our API, and customers can continue to use the application.
With data, these tools and processes don’t quite exist and the upstream and downstream dependencies on data are only increasing. Data observability does monitor machine to machine interactions, but it also helps with the many machine to person interactions. Consumers of data all have different use cases and requirements. Some consumers are okay with delays or infrequent issues (dashboards used bi-weekly), but other other consumers can’t have any issues and are used in real time (ML models).
If bad or anomalous data gets into Snowflake, it affects many different machines as well as many different types of people and use cases. It changes sales forecasts in Salesforce, emails being sent from HubSpot, and financial projections in board meetings. A data team often doesn’t know when issues are occurring until one of these consumers runs into an issue in their systems. So the data team is both impacted by more external systems and needs to communicate to many more people and understand the vast side effects. This impact is often determined by data lineage.
Roles: Software engineering organizations vs. data organizations. If you go from one organization to another, the engineering organizations may look different but generally fall into similar hierarchies of groups and roles. It’s easier to ask for budget, hire more engineers for research and development, and make the necessary investments in observability over time. Data teams, on the other hand, are highly entropic. In one organization, it could be entirely data scientists under the engineering organization. Or, it could be teams of data engineers and analytics reporting to the CFO. It’s often more difficult to ask for an increased budget and hire more data engineers.
Technologies and languages: Software stacks often differ quite drastically from data stacks, though there are meaningful areas of overlap. Each software system has different needs, resulting in two main levels of abstractions of infrastructure services: low-level services like Amazon Web Services, and higher-level abstractions like Heroku. These infrastructure providers provide computation and storage that can be used with your choice of language.
In contrast, data workloads are frequently optimized for moving large amounts of data from data sources to databases via data pipelines and then aggregating and joining large amounts of data, resulting in the use of technologies like MPP databases and technologies like Spark. This data is then used in business intelligence applications for decision making (e.g. Looker, Tableau) or piped into operational applications (e.g. Salesforce, Marketo) which are also specialized web applications. Machine learning and data science applications have their own stack, but are frequently based around Python as well. The lingua franca of data is SQL, paired occasionally with Python or R.
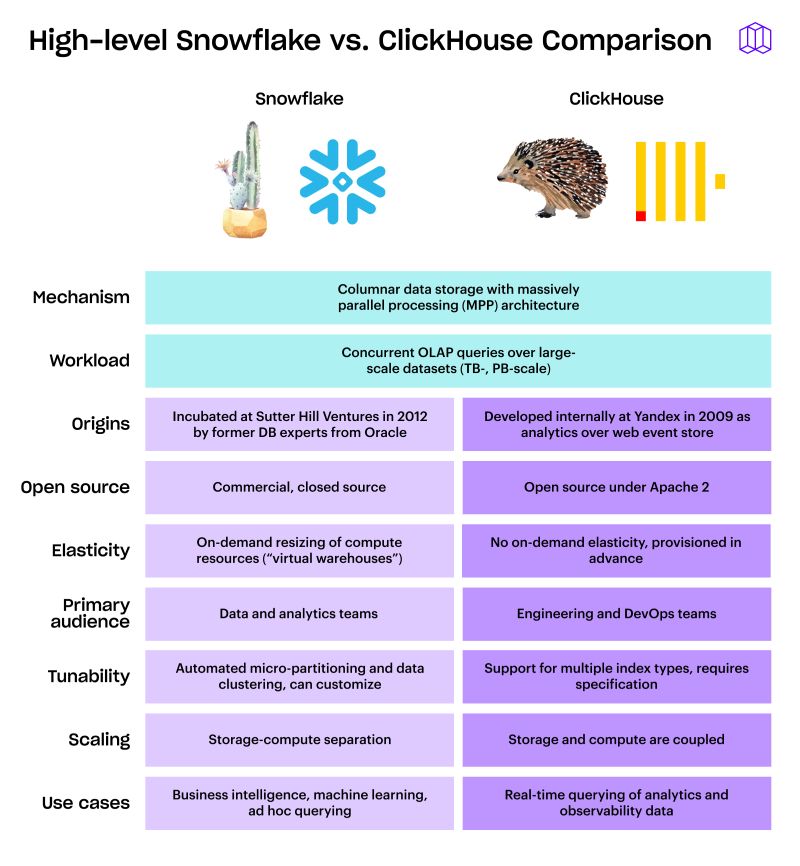
Ecosystem maturity: While the foundations of data systems were laid decades ago through the development of SQL (1979) and relational databases (1970), the players in the modern data stack are all less than a decade old, with Snowflake being created in 2012, Fivetran in 2015, dbt in 2016, and Looker in 2011.

What can Data Observability learn from Software Observability?
Focus on both symptoms and causes: Anil Vaitla, a founder and engineering leader at NOCD, put it nicely: you should probably monitor symptoms first, because that is most tied to the value of a user, but you should ultimately monitor both symptoms and causes. The purpose of monitoring causes is not necessary to fix the sources per se, but to accelerate the time-to-recovery of symptoms.
Centralization is productive: Modern data workflows are scattered across multiple screens. In order to get a sense of the health of a modern data stack, a data practitioner often has to have a database console open, a list of logs, a tab of dashboards, and more. Software Observability systems like Datadog have become one-stop-shops to access all pieces of information relevant to your software infrastructure. No such holistic view of the health of your data exists.
Workflows should be operationalized: Fixing software issues often follows variants of similar remediation playbooks, from identifying issues in a loop of Observe, Orient, Decide, Act (OODA), followed by crit sits to identify and notify impacted people, to retros that document issues in the form of post-mortems. Depending on the company, the process of fixing a data issue can be quite ad hoc.
Operations warrants a job on its own: The friction between software and IT has led to an new job-to-be-done called DevOps, which focuses on software engineering in tandem with deploying through a combination of philosophies, practices, and tools. We’re witnessing the rise of a similar job called DataOps that borrows from the DevOps philosophy, though we’re still in the early stages of development.
What is the ecosystem of data observability platforms?
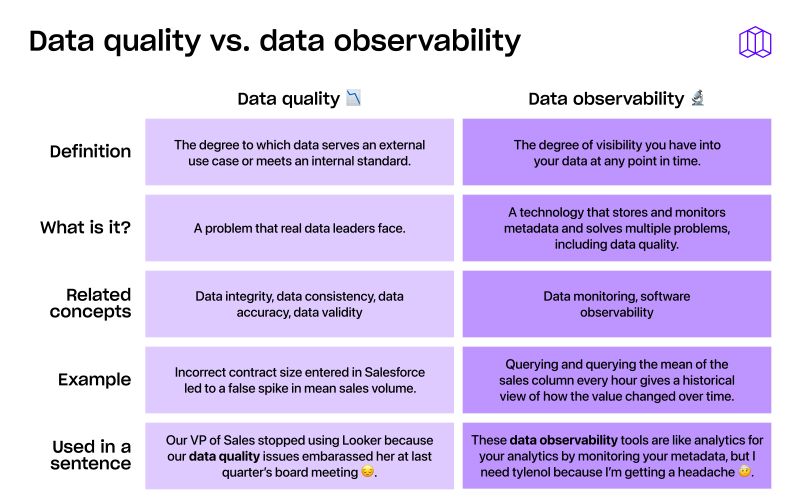
As of the time of writing, the category of Data Observability is only beginning to emerge, with each player approaching the problem from a different perspective. Matt Turck identifies players in key categories nicely in his Machine Learning, AI, and Data (MAD) Landscape, specifically in the form of data catalogs, data quality tools, and data observability tools.
Within data observability, there are an assortment of platforms that take different approaches, from those that focus on monitoring pipelines, to monitoring warehouses, to monitoring business metrics. At Metaplane, we like to say we’re building the Datadog for data, and we take that analogy very literally by focusing on centralizing metrics, metadata, lineage, and logs in a way that helps data teams operationalize their remediation playbooks and be the first to know of symptoms, while being knowledgeable of the causes.
Table of contents
Tags
...
...
