A 6-Step Process for Managing Data Quality Incidents

If you manage a multitude of data quality incidents every month, and you’re looking for a streamlined process for handling them, this blog post was written for you.
Every data quality issue is unique due to its potential causes and consequences. However, the process for resolving data quality issues is anything but.
Many industries already have well-defined playbooks for handling incidents. Today, we’ve chosen to borrow from the PICERL model, which is traditionally leveraged by site reliability engineers and stands for Prepare, Identify, Contain, Eradicate, Recover, and Learn.
Before we get started, let’s revisit a few key definitions:
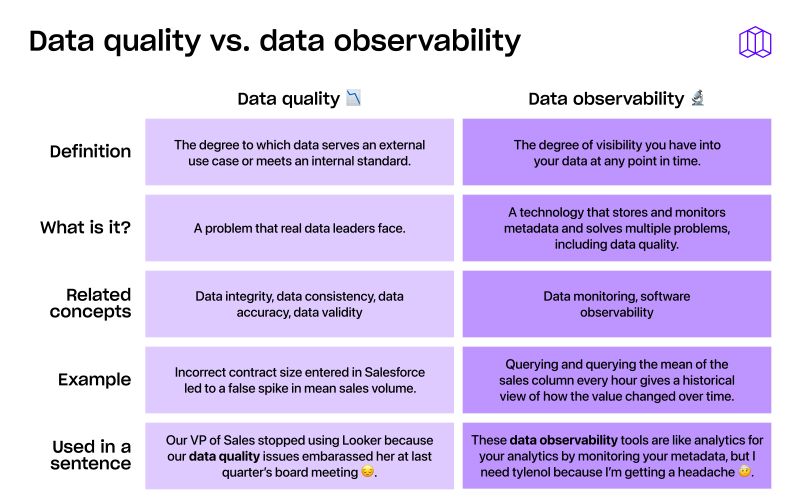
- Data quality is the degree to which data serves an external use case or meets an internal standard.
- A data quality issue occurs when the data no longer serves the intended use case or meets the internal standard.
- A data quality incident is an event that decreases the degree to which data satisfies an external use case or internal standard.
Now, let’s dive into the six-step process for managing these incidents.
Prepare
Preparation is about getting ready for the data quality incidents you’ll inevitably deal with in the future.
Keep in mind: Responding to data quality issues is not your primary responsibility, and it shouldn’t take up all of your time. Your job is actually to help your company make more money, reduce costs, and mitigate risk through more informed decisions and more effective actions.
So, while you should absolutely address data quality issues as they crop up, it’s important to be mindful of the bigger picture while you do so. After all, you can’t solve the larger problem while reacting to one data quality issue at a time. Instead, you need to focus your efforts on your broader objective.
Your ultimate goal should be to reduce the number, severity, and impact of data quality issues, as well as the amount of time it takes to resolve them. The number will never reach zero, but the people, processes, and technology available to you today can help you minimize data quality issues.
On the technology front, data observability platforms have helpful features like anomaly detection, lineage, and usage analytics. Together, these features empower you to quickly identify, investigate, and resolve data quality issues, reducing both your time-to-detection and time-to-resolution.
Identify
Identification is about gathering evidence that proves a data quality incident exists and documenting its severity, impact, and root cause.
Imagine that you’re the Head of Data at Rainforest, an ecommerce company that sells hydroponic aquariums to high-end restaurants, and that your data stack consists of modern tools like Snowflake, Fivetran, dbt, and Looker. Your VP of Sales pings you on Slack, saying something looks wrong on the company’s revenue dashboard in Looker. Specifically, the number of aquarium sales has tanked (pun intended).
What’s the first step you take?
Within the data community, we often talk about the trinity of triage—three investigations you must undergo to triage a data issue. Specifically, you must find out whether the incident is a real problem, how it has impacted stakeholders and other data assets, and what caused the problem to begin with. Only then can you fix the problem.
1. Is it a real issue?
Let’s start by figuring out whether the flagged issue is a real incident. To do so, you’ll need to look at any immediate evidence at hand. Do your best to confirm that the number of sales has dropped. Of course, you could take the message at face value, but it’s a best practice to corroborate it against similar pieces of information or similar places where the data is being used.
A few examples: If another dashboard goes down that depends on that table, you can be more confident that you’re dealing with an actual issue. You could also go one level deeper and inspect the data yourself by opening up the database and spot-checking it. Finally, if you’ve already set up anomaly detection software, you can search for a related alert. Your aim is to collect all the breadcrumbs that support the theory that a problem exists.
On the flip side, you can also be alerted to perceived issues that aren’t problems in reality. This investigation could thus help you confirm that the issue was temporary in nature. For example, if the number of rows dropped in between transformations but is in a good state now, you can move forward with confidence knowing the issue has been resolved.
{{inline-a}}
2. What’s the impact?
The next step is to evaluate the impact the issue is having on stakeholders and other data assets.
Here are some questions you might answer during this process to determine whether an issue is critical and, if so, to what extent:
- What tables depend on this table?
- What dashboards depend on those tables?
- What reverse ETL syncs depend on those tables?
- Is the data in question used internally for decision-making, or does it fuel customer-facing operations?
- Who uses the dashboard? How often?
- How important are those people?
While this investigation can be done manually, data observability tools speed up the process.
The thing is, an impact analysis is a combination of implicit knowledge that exists only in your mind and explicit knowledge that exists somewhere else, such as a Notion doc, spreadsheet, or data tool. No tool can capture a person’s knowledge, and no person can store metadata in their minds. So, both are needed to complete this investigation.
The goal of an impact analysis is to help you determine whether resolving the issue should be a priority. After all, data teams are busy, and not every data quality issue should take priority over your core responsibilities.
One helpful tool is Eisenhower’s Decision Matrix. You can use it to categorize data quality issues into four quadrants based on (A) whether they’re important and (B) whether they’re urgent.
Issues that are both important and urgent are your top priorities. You should focus on resolving these immediately.
Issues that are important, but not urgent, come second.
Most high-priority problems take time to solve and involve other people. That’s why it’s important to file a detailed ticket that documents your process, makes your team aware of the issue and its context, and schedules time to resolve it in the near future.
Issues that are not important, but are urgent, come third. You should delegate these to another team member, if possible.
Issues that are not important and not urgent should be dropped. At the end of the day, they’re not worth your time (or anyone else’s for that matter).
3. What’s the root cause?
Once you’ve evaluated the impact the data quality issue is having, it’s time to identify its root cause.
The key is to go backwards through lineage, from your dashboards all the way to your warehouse, and backwards in time until you find the root cause.
This is where domain expertise comes in handy. Every data stack is different, and you likely have intimate knowledge of how your data flows through the tools, making you uniquely positioned to conduct this investigation. Data observability tools, for example, can help you narrow down the possibilities, but ultimately it’s up to you to make the final decision.
After digging into the different parts of your data pipeline, explore how events unfolded across time. Say the issue occurred immediately after someone merged a pull request. Because the two events happened around the same time, there is a possibility that they’re related.
The goal of a root cause analysis is to determine whether the problem can be solved and, if so, by whom.
While you can build evidence for a root cause, the only way to know for sure is to fix the problem and check to see whether the issue is resolved.
Contain
Containment is about preventing the incident from escalating.
You want to contain not only the impact to your customers and internal stakeholders, but also the impact to the data team. After all, you need to be trusted in order for the data you deliver to be trusted.
Once you know the issue is worth dealing with, it’s time to revisit your impact analysis. Ask yourself: How will the data be used in the near future?
If it’ll be used externally, like in a customer email that’s scheduled to go out later today, the stakeholder should be notified immediately and asked to hit pause. Otherwise, the customer relationship and your internal reputation could be negatively affected.
The bottom line: If the issue is critical, be sure to show your stakeholders you’re on top of it. Outlining the problem and its impact, and giving them a rough timeline of when the issue will be fixed, is a good way to accomplish this goal.
If the data will be used internally, say to forecast next quarter’s sales, the stakeholder may not need to know if you know you can resolve the problem before the data is needed. Use your best judgment.
You want to strike a balance between being transparent and not overalerting your team. Otherwise, when a high-priority issue arises, you may not get the support you need to resolve it in a timely manner.
One important thing to keep in mind is that data quality issues rarely occur in isolation. We’re focused on tackling a single issue in this blog post, but reality is much more complex. It’s not uncommon for a domino effect to take place, where other issues arise in different parts of your data pipeline. This is why it’s essential to have end-to-end test coverage that alerts you to anomalies across your data stack.
Eradicate
Eradication is about resolving the problem.
During your root cause analysis, you determined whether the problem can be solved and, if so, by whom. Now it’s time to take action.
If you can fix the problem, go ahead and do it.
If someone else can resolve the issue, provide them with all the context they need to get the job done.
If no one can solve the problem, reach out to your stakeholders and explain why it’s not possible.
Ultimately, the action you must take is defined by the problem itself.
Recover
Recovery is the process of systems returning to a normal state following an incident. Before returning to normal, it's helpful to test the state of the system throughout the incident response process. This is where data unit tests come in handy.
Take the simple example of delayed metrics at Rainforest. The revenue numbers shown in Looker are 48 hours behind, and it’s causing strife in daily sales reviews. Freshness tests throughout the data warehouse indicate that not only are the metrics out of date, but upstream intermediate models are also out of date, even though transformations are running properly. It turns out that an in-house ETL process that enriches Salesforce data with 3rd party data has been failing silently for new records due to an API change. After upcoming the ETL process, the latest intermediate metrics and final metrics are up to date again. Once the team backfills for the missing days, recovery is complete.
Learn
The final step is to learn from the incident. Host a retrospective with your team where you document the incident, identifying both what went well and what could be done differently in the future.
You’ll also want to measure metrics that matter on a consistent basis and offer incentives to improve your team’s performance. At minimum, you’ll want to track every incident to be able to calculate the mean time it takes to detect and resolve each issue. You’ll also want to speak with stakeholders to see how satisfied they are with the process and outcome.
What have we learned?
The PICERL method is an effective way to manage your data quality incidents. You first need to zoom out and consider the bigger picture. How can you prevent future data quality incidents from happening and prepare yourself to efficiently deal with the ones that do occur? Once you’re alerted to a data quality issue, you need to gather evidence that proves a data quality issue exists and document its severity, impact, and root cause. The third step is to prevent the incident from escalating further. Next, you tackle resolving the problem before testing your data pipeline to ensure it’s functioning properly again. Finally, you do your best to learn from the incident.
Ready to get started? Sign up for Metaplane’s free-forever plan, or test our most advanced features with a 14-day free trial. Implementation takes under 30 minutes.
Table of contents
Tags
...

...


.webp)