How Snowflake enabled data observability
Before Snowflake, data teams were running hundreds of SQL queries that added to the backlog of their commands. The more queries got throttled, the more they backed up everything down the line—including their CEO’s dashboard. Thankfully, Snowflake came along and provided the technical foundation to turn scalable data observability from a dream into a reality.

Data quality issues have existed for as long as data.
From punch cards to the first relational databases to the modern data stack, data practitioners have been tasked not only with ingesting, storing, transforming, and using data, but also ensuring its quality.
At the same time, data technologies have always presented a tradeoff between quality and performance. For example, SQL scripts on Vertica necessarily competed with precious analytical workloads, like BI dashboards.
That was the norm—at least until Snowflake entered the scene.
More SQL checks, slower dashboards
Since the advent of the relational database in the 1960s, companies have run SQL scripts on cron jobs to check data quality. But when you have a shared resource model, like a single database deployment, every query uses the same memory and hits the same cache. There's a set number of bits that you can send over the wire, and there are many ways you can bump into a limit.
Think about it like a computer. If you’re doom scrolling YouTube late at night with 1000 tabs open, you’ll quickly run out of memory. The same logic applies to a database.
Before Snowflake, data teams were running hundreds of SQL queries that were adding to the backlog of commands. The higher the data quality, the more SQL checks they had to run, and the more load they were imposing on their database. More memory usage meant more queries got throttled, backing up everything down the line—including their CEO’s dashboard.
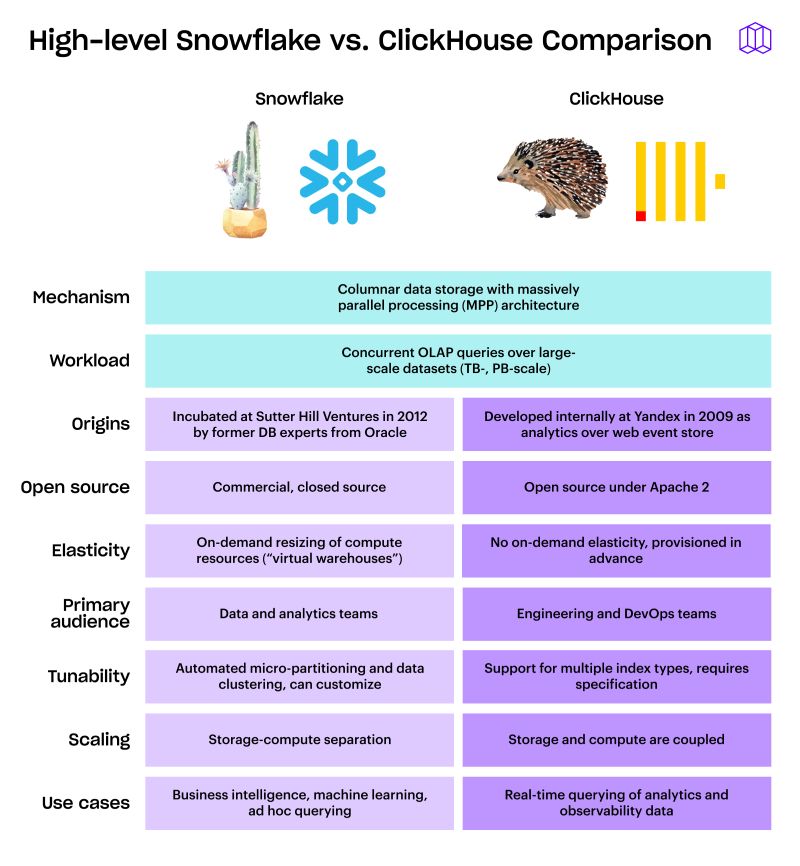
Snowflake parallelized virtual warehouses, so storage and computation no longer block each other. This was the first major step for huge improvements in data quality. Without Snowflake's massively parallel processing (MPP) architecture, continuous data monitoring would not be computationally feasible. Nor would it be financially feasible without the separation of storage and computation.

Snowflake’s MPP architecture allows you to add more computing power without changing your storage or increase storage without touching compute resources. This keeps everything running smoothly—even as your needs grow.
Using this architecture, as well as the support for metadata, easily queryable usage history, and advanced statistical/analytical aggregate functions, Snowflake provided the technical foundation to turn scalable data observability from a pipedream into a reality.
Support for rich metadata
Row count and freshness are the two most common (and arguably the most important) checks. They’re the highest level of abstraction that can give you a quick sense of whether something is wrong without needing to dive into the smaller details.
For instance, if row count and freshness are both normal, a data quality issue could technically be present. But if row count and freshness are not normal (e.g. a complete drop in rows or something is delayed by days), something is definitely wrong.

Snowflake makes the metadata needed for row count and freshness checks available in `INFORMATION_SCHEMA` metadata views like `TABLES`. So instead of running expensive queries to count rows or check the latest timestamps, data observability tools can quickly access this information through the information schema, saving users both time and Snowflake credits. The queries are more effective and essentially free of charge.
Easily queryable usage history
Query history is crucial to data quality, but query logs in many databases are easily lost. For instance, Redshift only stores usage history for 2-5 days, Databricks stores usage history for 30 days, and in general, most transactional databases don't have it on by default.
But Snowflake has easily queryable usage history—and they have for the past year. Data observability tools parse column-level lineage, usage of tables/columns, and performance and cost of queries over time for all core functionality, including:
- Prioritization. Parsing usage/lineage identifies which tables and queries are most important. This way, you can allocate resources, so that every part of your data infrastructure gets the attention it needs.
- Root cause analysis. When something goes wrong, quickly look back at past queries to identify what caused the issue.
- Impact analysis. Investigate anomalies to see what data products are affected, then communicate these data quality issues to the right stakeholders.
- Monitor the performance, usage, and cost of different tables. Track how often tables are accessed, how they perform over time, and how much they cost to maintain.
Without Snowflake’s usage history, data observability tools couldn’t function as efficiently—they’d have slower problem resolution, higher operational costs, and potentially lower data quality overall. But with Snowflake, data observability tools have the information they need to keep data systems running smoothly and effectively.
Advanced statistical/analytical aggregate functions
Important statistical functions (e.g. percentiles) are supported as first-class functions within Snowflake, which is both ergonomic and more performant. Snowflake also supports utility functions, such as counts or cardinality estimation using HyperLogLog.
All of these statistical functions are crucial for data monitoring and, as a result, observability beyond very simple checks. That saves data observability tools and customers like you from having to implement these complex functions yourselves, which is challenging at best, and at worst, impossible.
Snowflake’s built-in support for these advanced statistical functions means that users can perform detailed and accurate data analysis without additional effort, allowing you to focus on your core tasks rather than spending time and resources developing custom solutions.
Snowflake got the (snow)ball rolling
When we trace data observability back to its origins, Snowflake has played a key role in its development and evolution. But in parallel, Snowflake has also enabled a lot of consolidation in the data space.
Because Snowflake has taken over enough market share, partners like Looker and dbt have to spend less of their time building integrations. Instead, they can grow faster and also focus on what really matters: metadata interoperability.
Plus, with ML-powered features like Snowflake Cortex and Data Quality Metrics, Snowflake—by default—supports data observability features like automatic anomaly detection. To extend that support, they even invested in Metaplane!
Like the iPhone and Airpods, Snowflake and Metaplane are seamlessly integrated and best when paired together. So, if you use Snowflake and you need a data observability tool, you know where to turn.
Get started with these Metaplane features in less than 30 minutes for free. Just connect your Snowflake instance and we'll immediately generate column-level lineage from source to BI in a unified visualization map.
Table of contents
Tags
...

...


.webp)

