How To Become A Great Data Analyst
Data analysts are often the front line stewards of data in organizations. They need to understand how data should be structured and the types of questions that can and cannot be answered using the models they have helped create. Getting started as a data analyst can be intimidating because of the breadth of skills, systems and relationships that need to be built over time. But it doesn’t have to be that way!
As you think about stepping into the role of a data analyst, what are the key areas you need to focus your work and development to be great? Most people get caught chasing everything at once. Be a SQL master. Run predictive models. Create the best dashboards. Manage stakeholders expectations.
In this article, Lucas shares how you can become a great data analyst by asking the right questions and using the right tools for the right job.

Start By Adding Incremental Value
Getting started can be challenging because every role, team, and company approach data in different ways. The most effective way to make better use of data and advocate for higher data literacy at your company is to focus on solving small, but impactful business problems. Anchor yourself to one of the most important questions you can continue to ask: What is my team’s number one goal?
This should be relatively easy to find out, but if it isn’t, talk to a team lead and truly understand your team’s objectives and how they relate to your company’s bottom line, reputation, and mission. Take that goal and turn it into a performance indicator or a measure. Maybe your department has a goal to decrease cost of sale. You now have a starting point to find data and ask questions that will help your department reach that goal.
One of my favorite techniques for getting better at asking the right questions is the “5 Whys.” Maybe the first question you start with is - what team within the company is most effective at decreasing cost of sale? Are they ingesting and analyzing specific metrics that all teams should be using? Are they presenting or visualizing it in ways that drive correct decisions over time? From there, you want to keep asking “why”. Asking why will develop your skill to ask better questions. No question is stupid, ask it anyway.
You may have noticed that no tools have been mentioned yet. Everyone wants to use the latest tool. As you’re getting started, pick the analysis tool you are most comfortable in, not what everyone else is using. For many that tool will be Excel, and that’s perfectly fine! You should be focused on getting better at asking the right questions and finding value from the data you currently have. Then you’re ready to take on learning your first tool, and everyone’s friend - SQL.
Use A Versatile Tool Like SQL
SQL is like the stretch four (basketball anyone?) of a data analyst’s tool belt. Once you are comfortable with asking and answering the right questions, prioritize learning SQL. At first, focus on basic concepts like querying for data and joining tables. The more you use SQL, the more opportunities there will be to optimize the structure and efficiency of your code. Your queries won’t be perfect at first. That’s OK!
🏀A stretch four basketball player is a versatile player because they are tall and can play against and defend other tall players, but can also step outside and shoot three pointers.
While a whole series of articles could be written on different SQL patterns, one useful technique to improve readability and query maintenance is to use Common Table Expression (CTEs). A CTE is a derived result in the scope of your SQL query. In other words, it’s like a table or a view that you can call only within your query and goes away after your query has returned a resultset. Let’s say you have a SQL query that contains a subquery.
Over time, this query will become confusing and difficult to maintain as you add additional clauses and complexity. Try using more informative names and a CTE:
Notice how much more readable this code is. It executes exactly the same, but as your query grows, your future self will pat yourself on the back for having established this pattern.
There are several resources that can help you think about readability. Over time, create a style guide if your team doesn’t have one and align on a consistent and scalable way of writing SQL queries. This will help you as you write lots, and lots of SQL.
Another technique that is useful but rarely talked about is checking your execution plan. Over time, queries can become inefficient and take too long to execute. An execution plan is like a roadmap the database will follow to run your query with the best possible performance. This can come in handy when you start to notice queries hanging in the database, or dashboards taking a long time to load. Did you know that it only takes a few seconds (or less) for your users to lose focus on the task or even abandon it?
Once you have working SQL, it’s time to optimize it. Break your SQL into the smallest chunk necessary. Select only necessary columns, and within sub queries or CTEs limit the number of rows to only what is needed. From there, check the execution plan. This can be done differently depending on the database, but using the EXPLAIN command immediately preceding your SELECT statement can be a starting point. For more information about execution plans, check your data warehouse’s documentation (Snowflake, Redshift, BigQuery) for the best way to view it.
Some other techniques that may be useful are CASE statements, analytic functions, cross joins, and indexing. Find others in your organization who can help you level up in SQL, or start a data guild where best practices and technologies can be shared across the team. As you progress in SQL, you’ll use it to create metrics and pull data systematically. It’s time to understand how you design analyses and (sometimes) create dashboards.

Create a Dashboard (Sometimes)
In any sport, some strategies can be repetitive. For instance, does your team run the ball on first down every single time? We can all relate, and yet, the dashboard is the data analyst’s version of blindly running the ball every single time.
🏈In football, if a coach calls the same play every first down, the team becomes predictable and easily defended. In other words, it’s not an effective strategy.
Use dashboards to create certified, validated metrics that help others understand how they routinely change over time, and empower your organization for basic self service exploration. Outside of that, dashboards can be pretty limited. Use it for the basics. A dashboard is not an analysis. We need to stop creating a dashboard immediately as a request comes in.
Let’s say a teammate has asked for a dashboard. Your job is to step back and think. Why do you have a dashboard request? Is leadership seeing a spike of events in a certain area that they want to validate? Are they looking into penetrating a new market? Do they feel users have shifted their behavior? Dig into the real reason. A dashboard may be the answer, but in most cases, it isn’t.
When a dashboard is the correct solution, avoid some common mistakes. First and foremost, a dashboard is not a webpage where someone can download a row based excel file to do their own analysis. You might build that capability into a chart or figure later, but it should not be the sole purpose of your dashboard. If it is, what kind of explorer (depending on BI tool) type of access you can give them to do their analysis within your BI tool.
Dashboards are also not a page full of every chart you can think of so your business partner won’t bother you with basic questions again. Many times, it’s tempting to throw the kitchen sink at your business partner in hopes that it works.
Your job as an analyst is to use your expertise in data storytelling to convey the reality of what your measures and metrics are telling you. Start with the key purpose of the dashboard. Is the purpose to represent your company’s KPIs? Great, make sure you consider Year over Year (at the same point in time) measurements and an indicator of good or bad. Is it to highlight inefficient geography for stores in your company’s portfolio? Great, a geospatial dashboard might be just what that person needs. Think about the problem the dashboard will solve, and include only the information necessary to achieve that objective.
Use Statistical Analysis (Context Is King)
If you’ve determined a dashboard is not the right option, it’s time to pass the football on first down, or shoot the game winning three pointer with your center (ok, this analogy may not hold much longer). In other words, be versatile and change things up. If you want to make better decisions with data, use stats. For many, it’s been years since you have taken a stats class. Statistics is the science (and art) of using data to change your mind under conditions of uncertainty.
To set you and your team up for success, the first thing you want to strive for is an environment where stakeholders are open to changing their mind. Don’t find data in search of analysis or a programming language in search of using it. Find a solid problem with a decision maker willing to change their mind. If a decision maker is unwilling to change their mind, but you still believe in proceeding, do so with caution and work in small, iterative steps.
⚠️You can mitigate this risk by taking the decision maker on your journey and working with them closely. Be willing to pivot if the effort is unfruitful. This can be one of the most difficult challenges for a new data professional.
Once you have an analysis, a decision maker, data, and a problem to solve, it’s time to begin using statistics. Start with measures of central tendency for continuous data, and begin to lay out frequency charts and barplots to visualize outsized categories. Many people gravitate towards using a pie chart, but they quickly become uninterpretable as the number of categories increase.
Getting started is pretty easy in R: try using the hist function to create a histogram:
.png)
From there, begin to visualize your continuous distributions - what do you notice? Do you see a hump on the left side of the histogram? Two humps? Normal distribution? This will inform the techniques you use. The most unheralded and flexible visualization to use in this step, might be a boxplot.
Now that you have done your descriptive analysis; try more advanced techniques. Let’s say you want to know if your new shopping cart experience encourages people to increase total spend. You notice that both groups of data that was collected follow normal distributions. Try using a t-test!
Statistics begin to take the form of many advanced techniques as you grow your knowledge. For instance, maybe you want to classify two groups using an ML algorithm for quick insights. You begin to expand upon the concepts you learn from just knowing and understanding the t-test.
Use statistics instead of defaulting to creating dashboards, lead with an open business partner and decisions to be made and you will be able to quickly pick up tools and techniques.
Manage The Demands Of the Modern Data Stack
So far we have discussed what I call analytical services. These are analyses/insights that are provided to make or change decisions. They are part of the larger organizational decision making system. As a data analyst, you are also looking for places where you can create leverage. This means developing analytical systems.
An analytical system is a dashboard, predictive model, data model, or data mart that enables accessing data in a flexible way so you can make decisions informed by various cuts of the data. The key to these systems is finding the most common use cases and using techniques to automate them. As a data analyst, you are probably seen as a data provider as well.
Starting with services, what questions are commonly being asked? Can you create a data model to help answer those questions? When thinking about a data model, think about a singular purpose. What answer(s) can reasonably be expected of this table each time? This starts with a primary grain. Or, what fields create a unique row that can be summarized to various levels?
By giving your organization a single data model they can use, you have empowered your teammates and no longer need to write, run and provide results of that query whenever teammates ask.
One tool in the modern data stack that automates a lot of work associated with data modeling is dbt. However, depending on your tech stack, you probably have an ELT or ETL tool that you can use to manage and manipulate your data. Think about your business process, and model your data accordingly.
Though not a subject of this article, learning historical data modeling fundamentals (such as kimball) will give you the framework you need to consistently structure your data in ways that are usable for many purposes downstream. Dimensional modeling is a great starting point because its concepts are approachable and can improve your standing as a data analyst. Your work as a data analyst isn’t just automating SQL, it’s also about making data models available and usable.
As you model data, you also want to document what you are doing. What is the primary grain? How do the most common tables join together? Data catalogs may come into play here. The most underrated part of any analytical system is documentation that keeps the human out of the loop. Your company might have a data catalog, such as Alation, or it might have an internal wiki page. Find a centralized place for documentation and put that into place. You will thank yourself later as you and your team scales.
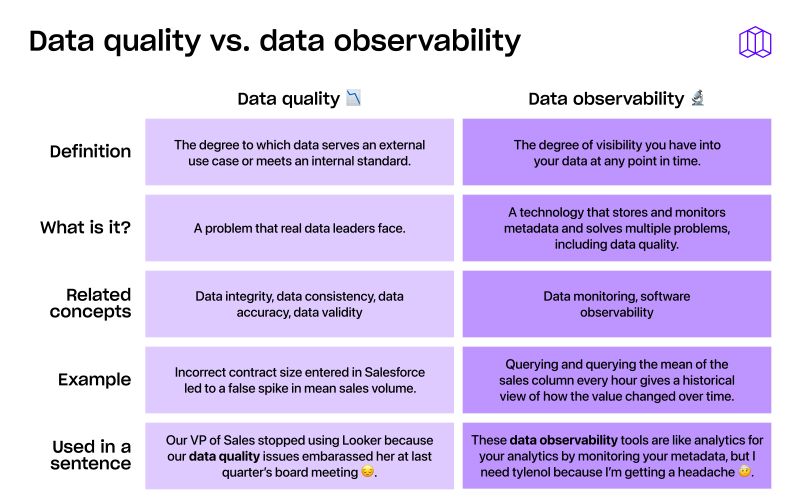
As your team scales and you create more assets, it can be tough to keep up. Think of data testing as part of model development, not part of the end state or a different project. When you think about how the modern data stack helps enable you as a data analyst, tools such as Great Expectations or Metaplane give you the ability to create a broad amount of tests to alert of changes to measures, dimensions, and KPI’s and manage expectations around your data service. Make sure automated testing is a part of how you live your life as a data analyst. Nothing is worse than having a dashboard or report incorrectly report a measure before you notice.
All of this work will create an internal struggle - how do I meet demands for both services and systems? I coach my teams to work toward 60% analytical systems and 40% analytical services. If you find a good balance, you and your team will be happy, always working on interesting problems and developing tools that create trusted sources of information for decision making within your organization. Don’t let the technology lull you into thinking about it alone. Think about the process and systems you are improving as a data analyst and everything else will fall into place.
Ask The Right, But Hard Questions
Getting started in any field is difficult, and becoming a data analyst is no different. Companies are ingesting more data than ever and there are new tools and technologies created every day. Data is being increasingly operationalized, so there are more external dependencies and stakeholders that impact and rely on data analysts.
That’s why focusing on asking the right, but hard questions should be your guiding principle from day one. Over time, the tools and technologies will change, but the first principles you develop will help you focus on what’s most important.
Remember that as you start as a data analyst, start with adding incremental value. Start with the tools you are most familiar with, and start learning more advanced SQL over time. Learn to understand what questions stakeholders are trying to answer instead of defaulting to producing dashboard after dashboard. When a dashboard isn’t sufficient, which is often the case, use statistics to provide analysis and trends. Lastly, familiarize yourself with some of the modern data stack tools to find ways of creating more leverage for your time, so you can create more analytical systems rather than services.
About the author
Lucas Smith is a Senior Manager of Data Analytics at Hudl, a software company changing the future of sports technology by providing performance analysis for sports at every level. If you enjoyed reading this article, follow him on LinkedIn where he shares tips on being an effective data analyst.
Table of contents
Tags
...

...


