

Introducing Partition Monitors: find data quality issues in segments of your data


When data teams get started with Metaplane, they typically add hundreds of monitors across their warehouses to ensure the data looks right. For example: is the total volume of data from source landing tables consistent? Is data arriving at the warehouse on time? Is the distribution of data in this table drifting?
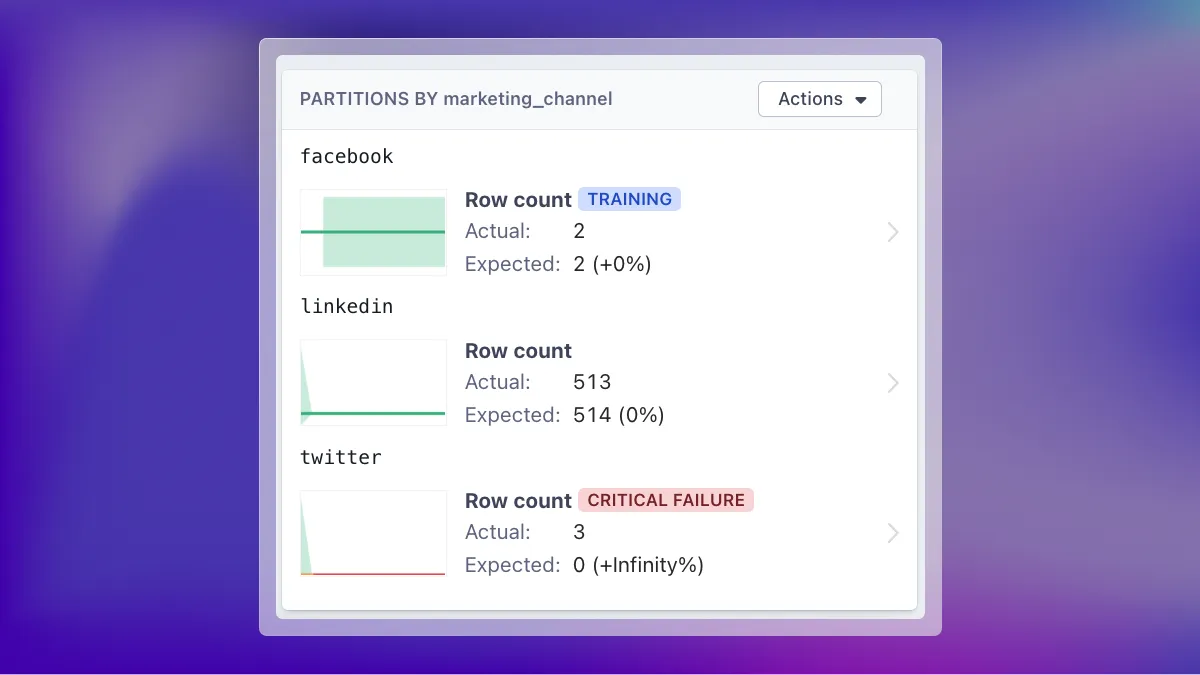
Monitoring aggregate values is a great way to establish a baseline understanding of how your data behaves. But let’s say the data team at Howl’s Moving Castles has started to dig into a table that tracks marketing signups by channel. While the row count of the overall table seems okay, they’ve discovered that the row count for the Twitter segment sometimes behaves erratically. That’s a problem, since Twitter is an important marketing channel at Howl’s. If there’s a data quality error within that segment, the team needs to know about it, even if the table itself is passing its monitors. What’s their data team to do?
Introducing partition monitors
We’re excited to share that Metaplane now supports partition monitors, a simple way to monitor important metadata like row count, nullness, distribution (and others) for specific segments of data in a table. Now you can easily monitor the data segments that are important to your company in seconds—no code required.
Entire companies, from sales and marketing to product and finance, rely on data teams and the data they manage to help them make faster, smarter decisions. This makes pinpointing exactly where data quality issues occur of the utmost importance. The faster you can identify, debug, and fix your issues, the faster your stakeholders can get back to doing their jobs.
Partition monitors can help. By surfacing anomalies for specific segments of data, you can identify an anomaly’s root cause and understand the downstream impact in a matter of seconds, rather than a matter of days.
Use cases: monitoring raw data and business metrics
Metaplane power users most commonly use partition monitors in two ways: to monitor the behavior of raw data, and to monitor their critical business metrics.
Monitoring raw data with partition monitors
Example: Monitor row counts for events by product type
Data teams frequently ingest product event data and model it to help product teams understand product usage, power rich user experiences, and automate customer messaging. Because the volume of that event data can be quite large, it can be helpful to monitor segments of that data instead. For example, if the row count or distribution of your event data suddenly drops for a specific product type, you can quickly identify the root cause and total downstream impact.
Example: Monitor row counts for leads by marketing channel
Marketing data is often replicated from source systems like Facebook, Twitter, and LinkedIn into data warehouses to analyze marketing campaigns or power downstream automations. In some cases, the amount of data being replicated from different marketing source systems can be drastically different. For example, Let’s say that your data from Facebook is incorrectly replicated into the warehouse, causing the row count to drop by 25%. By knowing that the aggregate row count for lead data is low, and the row count from Facebook in particular is low, you can save yourself significant time and effort digging up the source of the issue.
Monitoring metrics with partition monitors
In addition to monitoring for the volume, freshness, and distribution of raw data, Metaplane users are also adding partition monitors to metrics that are used by their sales, marketing, product, finance, and customer success/support teams.
Data quality issues impacting business metrics can have a range of root causes, from incorrect manual entry in Salesforce to bugs introduced to models by engineers. In addition to monitoring the aggregate distribution or nullness of metrics, you can also monitor your data by specific segments like product types, sales regions and reps, or marketing channels.
Example: Monitor order values by product type
Order values are important for many verticals, including e-commerce and SaaS companies. Partition monitors can help your team spot anomalies when bugs are introduced to billing systems, new products are not properly integrated, or source systems are missing order data.
Example: Monitor sales revenue by region or rep
Manual data entry into an upstream CRM is one of the most common causes of sales - and revenue - related data quality issues. Large deal amounts can throw an aggregate metric like the max or mean of all deals, but more subtle differences may be hard to spot. Using a partition monitor to identify anomalies in sales revenue by a region or rep will help you be the first to know when sales data is incorrect, as well as which region or rep had the anomalous value.
Example: Monitor conversion rate by marketing channel
Marketing teams rely on conversion data to measure campaigns and plan future work. If a data incident occurs that impacts conversion rates, your marketing team may be relying on incorrect conversion metrics when making these decisions.
Partition monitors are able to monitor metrics such as the nullness and distribution of data for conversion rates across specific segments of data. For example, by using partition tests, you could catch upstream issues that may be impacting Facebook’s conversion rates, but not LinkedIn’s.
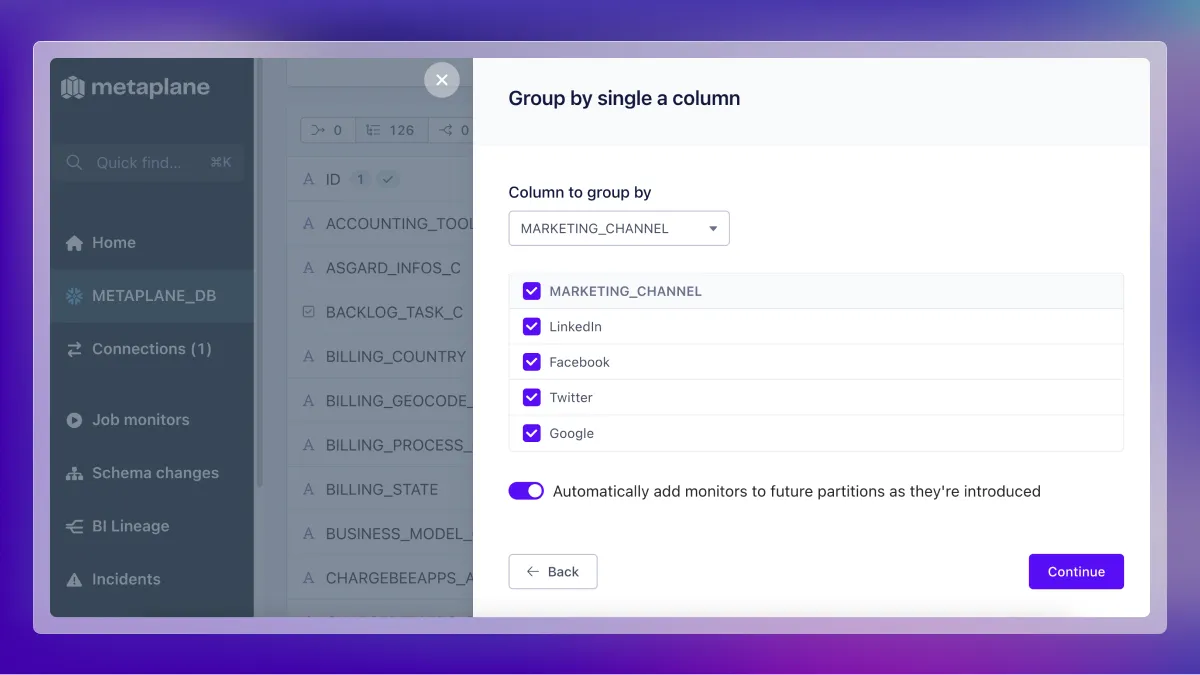
How to get started with partition monitors
Adding partition monitors takes seconds. Simply select the partitions you’re interested in monitoring, enable one or several monitors, and Metaplane will do the rest. Partition monitors are available on all paid plans, but can be trialed for 14 days on our free plan.
To learn more and set up your first partition monitors, read our docs.
Table of contents
Tags


...


...


