New Metaplane Dashboards and Menu
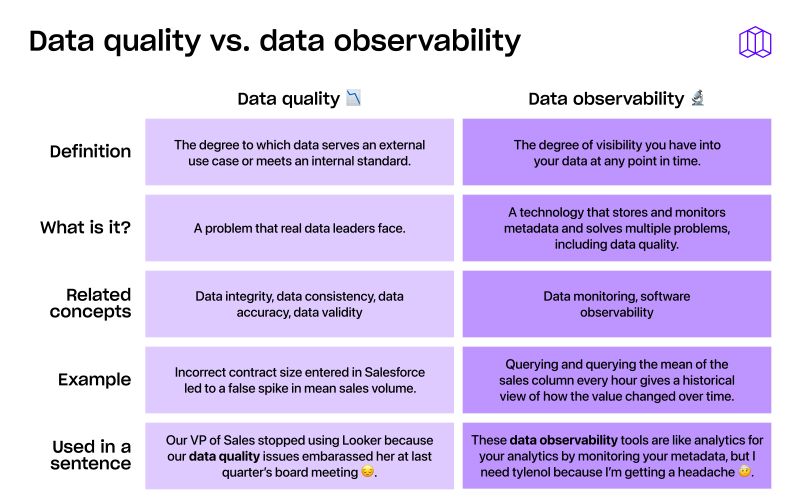
Here at Metaplane, we define data observability as the degree of visibility you have into your data at any given time. For most people looking to use Metaplane to improve data quality, that definition initially boils down to “the degree of visibility that you have into problems with your data at any given time”.
We break down how that's represented in our newest UI release.
.webp)
While Metaplane may also have features like usage analytics, Data CI/CD to proactively prevent issues, and column-level lineage to help find root causes and determine impact, at the heart of our platform is the ability to monitor your data stack for errors.
Taking a quick step back, with Metaplane, you’ll have the ability to leverage either our machine-learning based or your manual thresholds for monitors that will alert you to data quality incidents for your metric of choice. To make that useful for you, we had to also make sure that our product integrated with your data stack, so that you can find data quality issues whether you’re using a Databricks, another cloud warehouse, and/or a transactional database to store your data.
With that in mind, let’s take a look at how we’ve made it easier to gain insights into the state of your data and add monitors more easily where needed.
.png)
Integrations
The first thing that you’ll probably notice is the list of integrations denoted by their respective logos and your naming conventions. You can use this view to not only quickly explore the nested schemas and objects, but also see which already have monitor coverage. You can use that monitor count in conjunction with the icons denoting downstream dependencies or volume of queries to narrow down high impact objects to place additional monitors on.
You’ll also be able to see a high level view of object health with the number of open incidents grouped by Freshness, Volume, and Quality (all other monitor types).
If you’re looking to understand what’s happening in specific incidents, the panel on the top right corner of the dashboard provides more detail.
Open Incidents
This view in the dashboard that shows your most recent incidents gives you another option to understand what the current state of your data is. You’ll be able to click into any given incident for more detail, or use the link below the list to find all open incidents.
Teams have been able to use this as part of their recurring standups to prioritize any fixes based on the type and severity of incident.
Offline Monitors and Sync Issues
Finally, this dashboard also shows users more detail on their Metaplane configuration by outlining:
- Offline monitors: These can occur due to something like a Custom SQL query error and can help you quickly get your monitoring back on track when an unintended change has occurred.
- Sync issues: Part of Metaplane’s automated monitoring includes recurring sampling queries of your data quality metrics for your integrated tools. Our new dashboard highlights when sync issues occur that require integration attention.
Bonus: Everything new in Metaplane
This is going to be a bit, well, meta if you’re reading this from the new product updates notification pane on the dashboard. But the new notification pane is exactly where you should head to learn about all of our newest product updates and how you can take advantage of them. The menu is even smart: it remembers what you’ve seen and only shows a badge when there’s something brand new for you to check out.
.png)
How to use this
If you’re a current Metaplane customer, you can immediately use this new dashboard by logging into your account. Otherwise, you’ll need to:
- Create a free account.
- Integrate a warehouse. We also recommend adding an alerting channel, with Slack being our most used option
- Add monitors. Our platform also provides suggestions for where to start, based on your object usage and data types.
If you’re looking for more insights into how other teams are using Metaplane, we recommend reading their stories or reaching out to our team for more personalized advice.
Table of contents
Tags
...

...


