Top data observability tools to boost your data quality in 2025
The data observability tools ecosystem is relatively new—and evolving quickly. Read on to learn what these tools do, and how to evaluate which data observability platform suits your team in 2025.

In the data world, nothing's more frustrating than the dreaded "Why is this dashboard broken?" Slack message, or the subtle data quality issues that silently corrupt your analytics until someone makes a critical business decision with bad data.
This is why data observability tools have exploded in popularity over the last few years—helping data teams catch silent data issues and resolve them before they affect downstream assets. But with so many options available, how do you choose the right one for your team?
This guide will help you understand what to look for and which tools excel in different areas, so you can decide if you need an observability tool and which one is right for your team.
To start—what exactly are data observability tools?
Data observability refers to the ability to understand the health and state of data within a system by analyzing data from various sources. It provides broad visibility of the data landscape and dependencies, enabling data teams to build reliable data products despite the complexities of modern data stacks. Data observability tools are designed to ensure high-quality and error-free data by identifying, predicting, and preventing data issues in real time.
Data architects, data engineers, DevOps, site reliability engineers, and data executives find these tools crucial for minimizing data downtime. Data observability tools deliver insights into data quality, lineage tracking, and anomaly detection, empowering teams to produce reliable data products and uphold operational intelligence.
The core metrics these tools typically track include:
- Freshness: Is your data up-to-date or stale?
- Volume: Are row counts within expected ranges?
- Schema: Have there been unexpected structure changes?
- Distribution: Do the values in your data fit normal patterns?
- Lineage: What are the upstream/downstream relationships?
Observing these dimensions can typically tell you if something is gone wrong in your data pipeline, and where the problem is.
Crucially, a true data observability platform doesn't just monitor for known issues; it gives you end-to-end visibility and context to understand unknown problems. It automatically surfaces anomalies (often using machine learning) and provides context like data lineage and recent pipeline runs to help you quickly pinpoint root causes.
Why is data observability important?
Why should data engineers care about data observability?
Reduce data downtime
The importance becomes clear the first time you get caught off guard by a data issue. Data downtime—periods when data is missing, wrong, or unreliable—can be extremely costly. It wastes engineers' time, erodes stakeholder trust, and can lead to bad business decisions.
From reactive to proactive
Studies estimate that data professionals spend about 40% of their time firefighting data quality issues due to inefficient practices. That's almost half your productivity lost to reactive troubleshooting.
Data observability addresses this risk by shifting teams from reactive to proactive mode. Instead of waiting for a business user to raise a red flag ("Hey, why do our customer counts look off this week?"), a good observability tool will catch the anomaly and alert you immediately—often with enough lead time to fix the problem before it impacts end users.
Real-time alerts and early detection of data issues empower data teams to take corrective actions promptly, ensuring high-quality data and operational efficiency. Aligning data observability tools with business needs allows organizations to optimize costs, maintain operational efficiency, and enhance data system reliability.

Simplify complexity
Another reason data observability is crucial is the sheer complexity of modern data environments. With data from dozens of sources, transformed through complex pipelines, and served to various analytics tools, keeping tabs on all these moving parts manually doesn't scale.
Observability tools act as a centralized watchdog across your entire data platform. Data observability is essential for maintaining data accuracy, reliability, and consistency. Data observability platforms provide complete visibility into data assets, enabling organizations to identify and remediate issues before they impact business operations.
Save money
Sure, data observability tools cost money, but the cost of bad data is far greater. Comprehensive data monitoring through data observability can save you loads of money while preserving trust both internally and with customers. Plus, some tools provide data warehouse spend monitoring and help you save money that way, too.
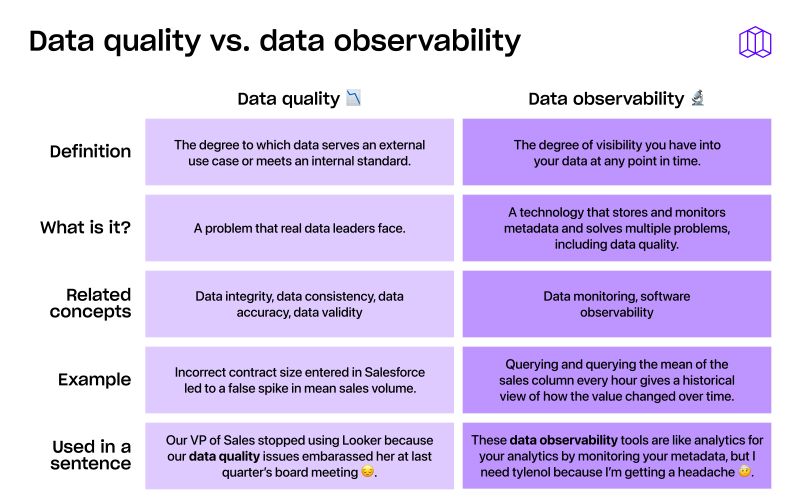
How data observability differs from data monitoring
This question comes up a lot—how does data observability differ from data monitoring? The best way to think about the two is by thinking data monitoring as a subsect of data observability.
Data monitoring is tracking predefined metrics and alerting when they go out of bounds. For example, you might monitor that your nightly ETL job succeeded or that today's row count is within 5% of yesterday's.
Data observability encompasses monitoring plus much more context and intelligence. A useful analogy is the difference between basic uptime monitoring and full application observability. Monitoring might tell you a server's CPU is high, whereas observability helps you trace why by analyzing logs, metrics, and traces together.
Similarly, data monitoring might catch that "table row count dropped 30% last night," but an observability tool will put that in context: perhaps a downstream dashboard is now showing blank results, and the drop was due to an upstream file not arriving, which ties to an Airflow job failure.

If monitoring asks "is everything okay right now?", observability asks "how and why is everything behaving this way, and will it continue to be okay?"
Essential features of effective data observability tools
The data observability tooling category is still young and moving quickly. With that said, there's a wide variance in what you're getting with each tool. Not all data observability tools are created equal. So, what kinds of features should you look for in a data observability tool?
When evaluating tools, look for these key features:
- End-to-end connectivity: The tool should connect to your existing data stack quickly and seamlessly, without requiring you to re-engineer pipelines or write custom code.
- Automated monitoring: A strong platform leverages machine learning to automatically learn your data's normal patterns and set intelligent thresholds. You shouldn't have to manually configure hundreds of rules for every table.
- Broad coverage: The tool ought to monitor many data quality dimensions out-of-the-box: freshness, volume, schema changes, distribution, and lineage.
- Rich context for root cause analysis: Once an anomaly is detected, you need to diagnose it. Look for tools that provide lineage graphs, information on recent pipeline runs, and the ability to drill into the data itself.
- Incident management and alerting: A practical observability platform will integrate with your workflow via Slack, email, PagerDuty, etc., with configurable alert rules and severity levels.
- Proactive testing and prevention: The best solutions help prevent issues, not just react to them. This includes integration with data testing frameworks or CI/CD processes to catch problems before they hit production.
- Scalability and performance: A good platform should handle large data volumes and complex pipelines without bogging down.
- Ease of use: Data engineers are busy; a tool that is easy to set up and use will drive adoption.
The 7 best data observability tools in 2025
Taking the features we just listed into account, here's a list of top data observability platforms to check out.
Top data observability tools at a glance
1. Metaplane—Best all-around data observability platform
.png)
You're on the Metaplane blog right now, so I understand any skepticism, but if you're looking for a powerful data observability platform that you can get up and running with quickly, Metaplane is for you.
Metaplane is the most well-rounded data observability solution—providing end-to-end visibility from ingestion to BI dashboards, while also ranking the highest in the market for ease of use (among plenty of other categories).
Metaplane also takes a smarter approach to monitoring. Rather than monitoring every single data asset and getting flooded with alerts, Metaplane suggests which tables to monitor based on usage—prioritizing your most critical ones so that your alerts are always high-impact.
Speaking of alerts, our custom-built ML-model learns your data's patterns and only notifies you about genuinely problematic anomalies. Not only do our alerts notify you about anomalies, but they enable you to investigate and resolve them without quickly.you The system automatically builds lineage maps to help you quickly trace issues to their source.
Other worthy features to note include:
- Data lineage all the way down to the column level
- Data CI/CD so you can forecast the downstream impact of changes before making them
- Schema change alerts to detect and resolve changes quickly
- Job monitoring to catch abnormal dbt runs
Pricing: Free trial available. Team plans start at $500/month. Enterprise pricing available upon request.
2. Monte Carlo—The incumbent; enterprise-first

Monte Carlo pros:
- Strong data catalog integration
- Robust governance and compliance features
Monte Carlo cons:
- Higher price point
- Steeper learning curve
- Noisy alerts
Monte Carlo has positioned itself as an enterprise-focused solution with extensive capabilities for large organizations. Its strength lies in it's integration ecosystem—being able to connect to niche tools along with all the bigger players you might expect.
The platform excels at connecting technical monitoring with business impact assessment, helping prioritize issues based on downstream effects. Its catalog integration also helps teams understand data in context, bridging the gap between observability and governance.
However, G2 reviewers have mentioned Monte Carlo’s out-of-the-box monitors being less effective on datasets that update infrequently (like monthly data). They had to rely on custom monitors in those cases, which reduced the tool’s ease of use. And, with Monte Carlo's monitor everything approach, users tend to recieve a lot of unnecessary alerts.
For large enterprises with complex data environments and dedicated data reliability engineering teams, Monte Carlo can provide the depth of functionality needed, though at a higher price point.
Pricing: Enterprise pricing model, typically starting in the tens of thousands annually.
3. Bigeye—Best for customizable monitoring

Bigeye pros:
- Highly customizable monitoring rules
- Strong SQL-based metric definition capabilities
- Good balance of automated and manual controls
Bigeye cons:
- Requires more configuration than fully automated solutions
- Limited feature set beyond data quality monitoring
Bigeye takes a slightly different approach to data observability, emphasizing customizability. While it offers automated monitoring, its strength lies in letting data teams define precisely what to monitor and how.
The platform's SQL-based metric definition system gives engineers granular control over their monitoring strategy. This makes it particularly suitable for teams with specific monitoring requirements or those who want to codify their data quality expectations in precise terms.
The downside to that, though, is that integrating Bigeye into your data stack can be laborous. Plus, Bigeye lacks some of the features outside of monitoring—like robust lineage and broader pipeline context—that some competitors offer.
If your team has clear ideas about what constitutes data quality and wants fine-grained control over monitoring parameters, Bigeye offers a lot of flexibility.
Pricing: Starts at approximately $1,000/month for small teams.
4. Soda—Best open-source foundation
.png)
Soda pros:
- Open-source core with Soda SQL
- Code-first approach that integrates with existing workflows
- Strong testing framework
Soda cons:
- Requires more technical implementation
- Less automated anomaly detection
Soda takes a developer-centric approach to data quality with its open-source Soda SQL tool and cloud platform. This resonates with data teams that prefer code-first solutions that integrate with existing CI/CD workflows.
Soda emphasizes testing over purely observational monitoring, letting teams define explicit checks that data must pass. This approach works well for teams transitioning from software engineering practices to data engineering.
For organizations that value open source, want to avoid vendor lock-in, or prefer to integrate data quality checks into their existing development processes, Soda provides a compelling option.
Pricing: Open-source core with paid cloud platform starting around $500/month.
5. Great Expectations—Best for data testing framework

Great Expectations pros:
- Developer-friendly, Python-based framework
- Excellent documentation and testing capabilities
- Open source with strong community
Great Expectations cons:
- Requires engineering resources to implement
- Less automated anomaly detection
- More testing than continuous monitoring
Great Expectations approaches data observability from a testing perspective. The open-source Python framework allows teams to define "expectations" (see what they did there?) about their data that can be verified at any point in the pipeline.
While not a traditional observability platform with dashboards and alerts, Great Expectations excels at building data quality checks into your existing workflows. It's particularly valuable for data scientists and engineers comfortable with Python who want to enforce quality standards programmatically.
For teams with strong Python skills looking for a flexible, code-based approach to data quality, Great Expectations offers a powerful foundation that can complement other observability tools.
Pricing: Open source core is free. Cloud offering starts at approximately $500/month.
6. Datafold — Best for CI/CD integration

Datafold pros:
- Excellent dbt integration
- CI/CD focus prevents data issues before deployment
- Powerful diff capabilities
Datafold cons:
- More focused on transformation than full data lifecycle
- Less comprehensive monitoring features
Datafold takes a proactive approach to data observability by focusing on catching issues before they reach production. Its data diff capabilities let teams see exactly how code changes will affect their datasets, similar to how code reviews work for software.
The platform's deep integration with dbt makes it particularly valuable for teams using that transformation tool. By automatically validating changes as part of the CI/CD process, Datafold helps prevent many data issues from occurring in the first place.
For teams heavily invested in dbt who want to catch data problems before deployment rather than after, Datafold offers specialized capabilities that complement broader observability platforms.
Pricing: Team plans start around $600/month.
7. Acceldata — Best for data infrastructure monitoring

Acceldata pros:
- Strong infrastructure and performance monitoring
- Good for big data environments
- Comprehensive cost optimization features
Acceldata cons:
- Less focus on business metrics and data quality
- More complex implementation
Acceldata focuses on the infrastructure layer of data observability, monitoring the performance and health of your data systems themselves. This approach is particularly valuable for organizations running complex big data environments where performance issues can cascade into data quality problems.
The platform provides deep visibility into resource utilization, helping teams optimize costs while maintaining performance. Its comprehensive monitoring of data infrastructure makes it suitable for organizations where system reliability is a primary concern.
For teams managing complex data infrastructure who need visibility into system performance alongside data quality, Acceldata's infrastructure-centric approach complements other observability tools.
Pricing: Enterprise pricing, typically starting in the tens of thousands annually.
How to pick the right data observability tool
Consider these factors when choosing:
- Identify your primary goals: What specific data quality issues are you facing? Different tools have different strengths.
- Consider tech stack compatibility: Ensure the tool integrates with your warehouses, ETL/ELT tools, and BI platforms.
- Team size and expertise: Choose a tool that matches your team's capacity and skillset.
- Budget and pricing model: Consider free tiers, consumption-based pricing, or enterprise licensing based on your needs.
- Balance automation vs. control: Decide if you prefer a "black box" that handles everything or want more control.
- Try before you buy: Take advantage of free trials and create test scenarios with your own data.
Challenges addressed by data observability tools
Data observability tools are essential for comprehensively managing the health and performance of an organization’s data ecosystem. They provide automated monitoring to identify and resolve data quality issues, ensuring pipeline reliability and operational efficiency. Enterprise-level data observability tools must support extensive user access controls and compliance features to meet regulatory requirements.
By predicting operational issues before they occur, tools like Acceldata enhance data reliability and reduce the time taken to detect data issues. For instance, Contentsquare managed to decrease the time taken to detect data issues by 17% within a single month through data observability.
These tools also support high availability and robust performance, ensuring that data systems remain operational and efficient.
Ensuring data integrity and reliability
Real-time monitoring maintains data health, tracks data flows, and provides notifications of issues, preventing problem escalations. Data observability tools ensure data quality and data freshness by continuously monitoring for anomalies and errors, helping identify vulnerabilities and automating safeguards to prevent costly errors.
Enterprise data observability platforms can quickly address and prevent issues related to data quality. This helps maintain high reliability. Visualizing data lineage helps identify root causes of data issues, ensures compliance, and improves data governance, reducing operational costs through automation of monitoring and troubleshooting.
Rapid issue resolution
Rapid issue resolution is a crucial feature of data observability tools, allowing organizations to respond swiftly to data issues. By enhancing incident management, these tools improve the speed and accuracy of identifying issues, leading to quicker resolutions and minimized disruptions in data workflows.
Managing complex data environments
Data observability tools are crucial in maintaining high levels of data integrity and reliability, ensuring that data remains trustworthy and accurate amidst complex environments. Automated anomaly detection and root cause analysis capabilities empower teams to swiftly identify irregularities and understand the underlying issues affecting data quality.
Seamless integration with existing systems is essential for data observability tools, ensuring compatibility and enhancing the management of complex data environments. This capability allows organizations to adapt to dynamic environments and handle changing data patterns effectively, improving overall data management.
Final thoughts
Data observability has become an indispensable component of the modern data engineering toolkit. With the right observability platform, you can dramatically reduce time spent firefighting issues, increase stakeholder trust, and focus on building valuable data products instead of chasing bugs.
Remember, the best tool is one that fits your specific needs and environment. However, investing in quality observability now will pay dividends as your data ecosystem grows more complex. Just as DevOps teams wouldn't deploy critical applications without monitoring, data teams shouldn't operate pipelines without observability.
By adopting the right data observability platform, you'll be able to catch issues before they impact users, understand the root causes faster, and ultimately deliver more reliable data products to your organization.
Table of contents
Tags
...

...


