How to Evaluate Data Observability Tools
This piece is written for data practitioners that are looking for a framework to evaluate data observability and quality monitoring tools.

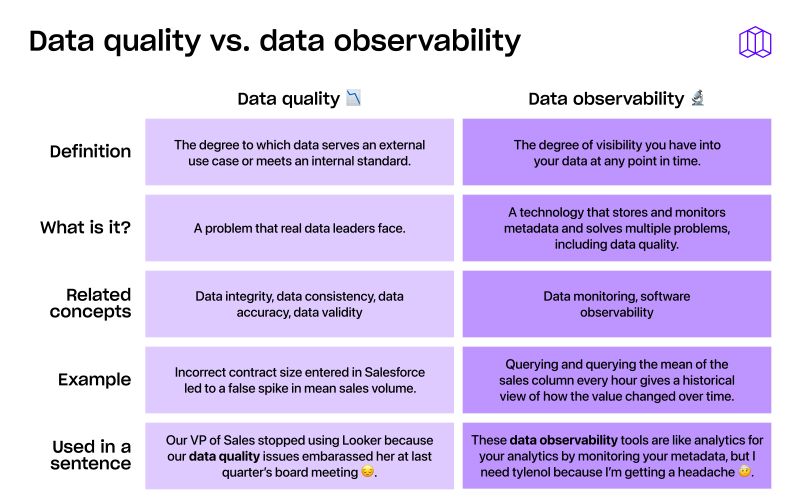
Defining the Problem: Data Quality Issues
Organizations that rely on data to drive their business decisions are aware of the large reach that their data engineering team has. Therefore, it’s no surprise that these teams are swamped with massive tech debt, a labyrinth of dependencies, and ambitious roadmaps. These roadmaps usually cater toward more obvious goals: creating curated datamarts for analysts and data scientists or establishing robust data pipelines to new data sources.
As a result of massive backlogs that are heavy on feature building, stakeholders of data engineering teams often discover data quality issues before engineers do. This erodes trust in the data platform. The less reliable that data is for analysts and data scientists, the more likely that they will go directly to source data with poor performing queries to do their job. Stakeholders need confidence, and engineering teams have to earn it.
While most data teams write some tests in their ETL orchestration tools (which is dbt for ezCater), they’re often too basic to accurately account for the complexities of data quality (like machine learning for row count thresholds and freshness variability). Even if you write basic testing for every column and table, tweaking and fine tuning tests can be a massive waste of precious engineering time, making the testing unfeasible without automation. Don’t get me wrong, dbt is a great start! But there are no super easy ways to programmatically interact with tests, and don’t get me started on the amount of YAML...

Benefits that a Data Observability Tool Should Provide
There are 3 main things we look at when we proof-of-concept (PoC) tools for data observability:
Baseline Testing Improvements -> A tool should improve our baseline testing and alerting strategy by utilizing predictive models to describe anomalous behavior with machine learning-based anomaly detection. These models should cover different data dimensions of data quality including freshness, row counts, and more advanced tests like expected values tests (i.e. is the latest value in an accepted range?) across different types of metrics and metadata. While dbt is great at what it does, it’s not smart enough to meet our data quality needs at scale.
Test Drive Development -> A tool should change the way we develop SQL in order to be more test-driven. When writing SQL, data engineers sometimes view testing as an afterthought. Ideally, a Data Observability tool will help orchestrate complex tests on custom cadences and help facilitate test driven development (TDD). Testing strategies need to be comprehensive in order for data to be trustworthy.
Features Galore -> A tool will provide better out-of-the-box features than dbt (or whatever ETL orchestration tool your team uses), but which ones do you care about? Examples include: mechanisms to reduce noise fatigue, integrations with all data systems and data pipelines, processes for managing tests, real-time schema change alerting, tracking errors down to the column and dashboard through data lineage, and programmatic ways to interact with tests. Simple pass/fail testing won’t cut it when your team size and table counts double, so the more features a tool has the better! Over all of this, ideally a tool can provide a global view of the health of your data.
Scope of Evaluation
PoCs for other tools usually require less data, where you explore a smaller sample in greater depth. But data observability tools demand a broad implementation in order to be successful.
If you PoC an observability tool against 10 data tables or data assets in 1 data system, odds are that the models won’t fail during a trial period. In order to get an accurate understanding on how healthy your data is, you need a pulse on all of it. Every organization has imperfections in their data, it’s finding them that is challenging.
The length of the trial period for data observability platforms depends on how long the models take to train against historical data. Most tools take about 1-2 weeks to sufficiently train. Add about 2 more weeks of monitoring alerts and exploring UIs, you’re looking at about 30 days to get a grasp on the “bones” of the tool and how your team can leverage it.
Strategies for Evaluation
A quick and easy way to start the evaluation is by manually triggering errors to see how different tools interpret the same problem. It’s up to you to evaluate whether it’s worth triggering this sort of alert, or whether there’s enough errors occurring already.
Get frequent team input to help encourage adoption once you finalize your selection. The more people that are excited about better quality data, the faster you’ll get to a healthy state.
Alerting needs to be smart in order to be scalable. Are notifications easy to configure? Does this tool route the right errors to the right channel? What dashboards are affected? Are expected values flagged as anomalous? The last thing you need is a tool that alerts you too often over discrepancies that are too insignificant. Crying wolf can numb the team to real outages and bad data.
Notification fatigue has never been more present in the remote age, and making sure that your team can develop a workflow for monitoring alerts is crucial, so having a flexible tool is key. When your alerts are expected, you want to make sure there are easy ways to relax a model's sensitivity. For unexpected alerts, you need to make sure that a tool can successfully facilitate team intervention.

Why are we adopting a data observability tool at ezCater?
Our team size and data volume are scaling rapidly at ezCater. When it comes to data quality, we are driving a car that’s too old on a highway that’s too fast for us to keep up with. We’re at an inflection point, past which hidden failures will continue to go unnoticed and cause trust in our platform to deteriorate.
At this scale and speed, minimizing data downtime and maximizing data reliability are critical. Our stakeholders need confidence in our data ecosystem in order to be effective in their decision making. A tool will help us diagnose and fix existing quality issues as well as facilitate a test driven development strategy to prevent future ones. We want to fix our current state and future-proof our data once and for all through an investment in DataOps through the data lifecycle.
Summary
With the concept of alerting in mind, coupled with the benefits of improving baseline testing, supporting test-driven development strategies, and the long-tail of features, you should have enough variables against which you can plot the merits of different tools.
About the author
Wes Baranowski is a data engineer at ezCater working primarily on data infrastructure. This is his first full time gig since he graduated from Northeastern University during the start of the pandemic. You can find him and reach out on LinkedIn.

Table of contents
Tags
...

...


