

Data quality vs data observability: How they differ but work together
Data quality versus data observability isn't a debate. These two concepts work together—one as the goal and one as the means. Discover the nuances of both in this article.


If you work in a data team, you’ve likely heard the terms data quality and data observability thrown around. They might even seem like buzzwords used interchangeably. After all, both concepts ultimately aim to make sure you can trust your data by ensuring it is accurate and reliable data.
But while they’re closely related, they aren’t the same thing. Think of them as two sides of the same coin: one defines what high-quality data looks like, and the other provides visibility into whether your data meets those standards in real time.
In this post, we’ll break down the difference between data quality and data observability, show how they complement each other (rather than compete), and share practical examples and tips from one data engineer to another.
Data observability vs. data quality at a glance
What is data quality?
Most data people understand data quality from experience. In essence, data quality is about how well data meets the needs of its intended use or adheres to an organization’s standards.
In other words, data quality measures whether your data is accurate, complete, timely, consistent, and fit for purpose. High-quality data means you can trust it to drive decisions; low-quality data leads to errors, mistrust, and “WTF” messages from stakeholders asking why the dashboard is wrong.
The ten dimensions of data quality
Data quality is a broad concept with many facets. Industry literature often breaks it down into ten dimensions—five intrinsic dimensions and five extrinsic dimensions.
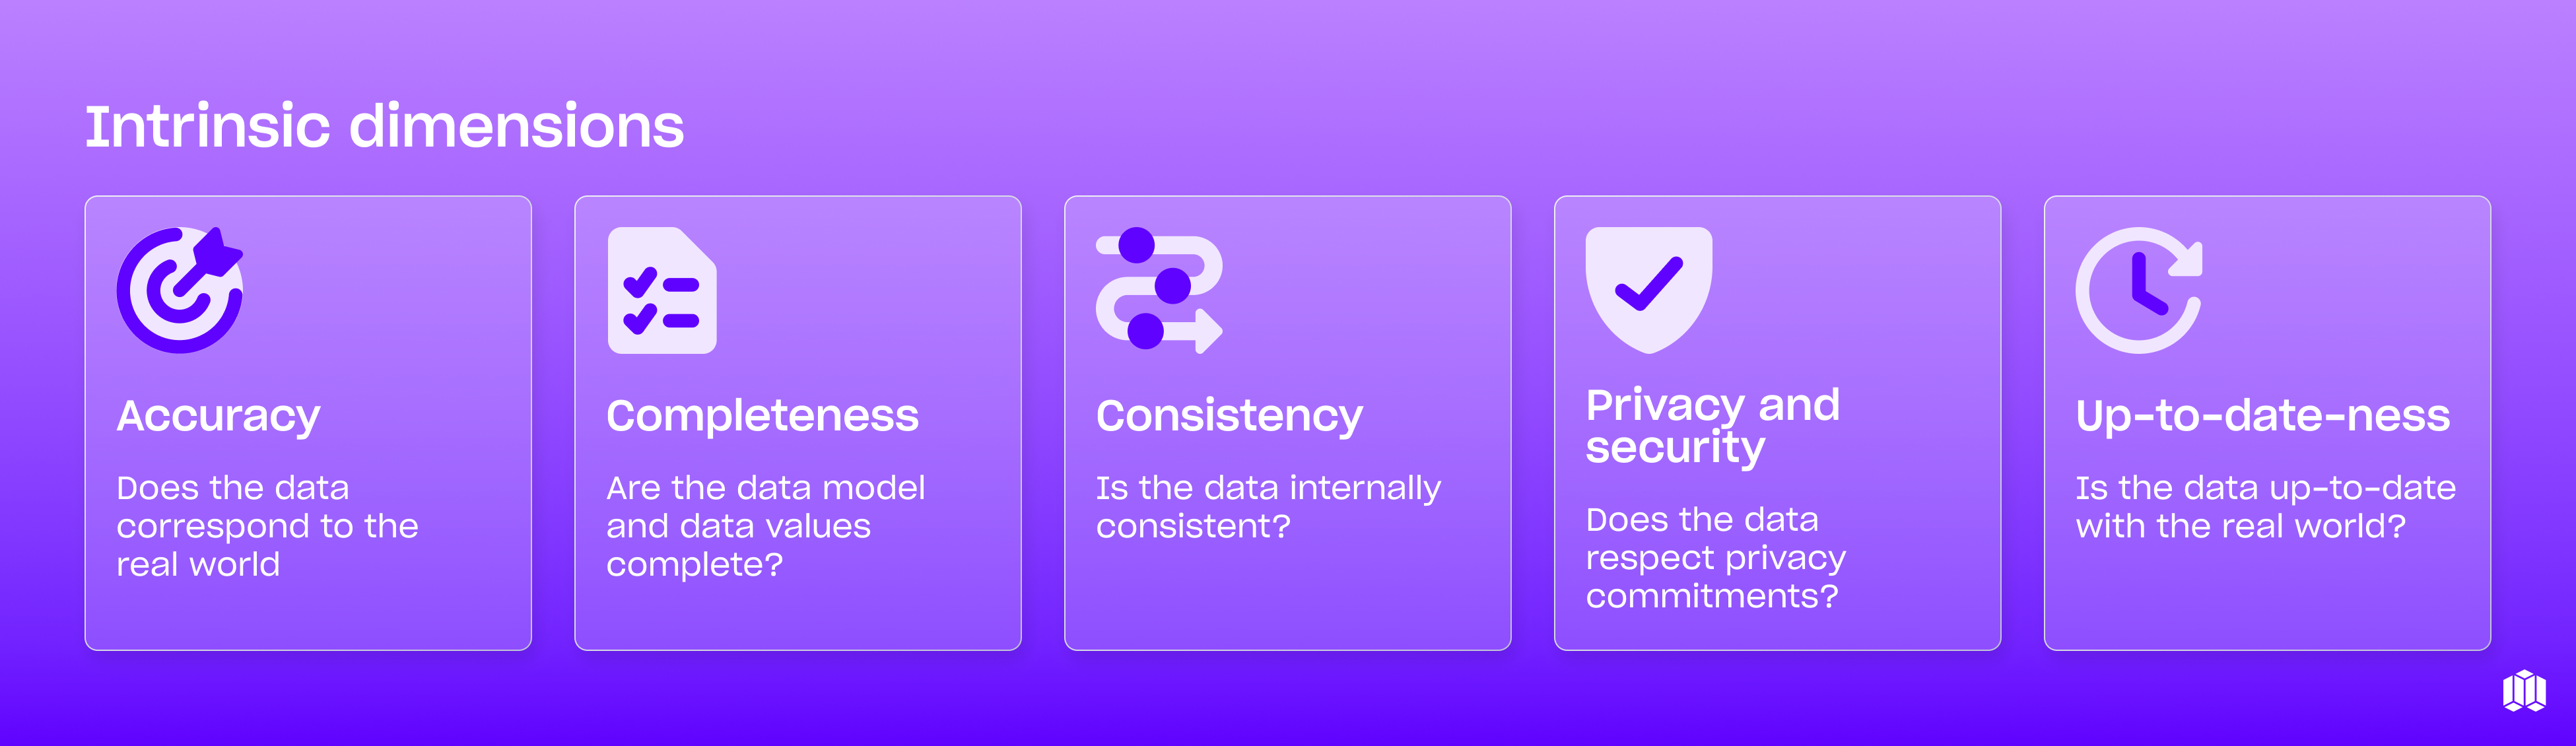
Intrinsic dimensions:
- Data accuracy: Does the data correctly represent the real world? For example, if your data shows a customer made 5 purchases but they actually made 7, that's an accuracy problem.
- Data completeness: Are the data model and values complete? Missing values can significantly impact analysis outcomes.
- Data consistency: Is the data internally consistent? For instance, if the same customer is listed in multiple systems with different attributes, that's a consistency issue.
- Data freshness (or up-to-date-ness): Is the data up-to-date with the real world? Outdated information can lead to incorrect decisions.
- Privacy and security: Does the data respect privacy commitments? This dimension has become increasingly important with regulations like GDPR and CCPA.
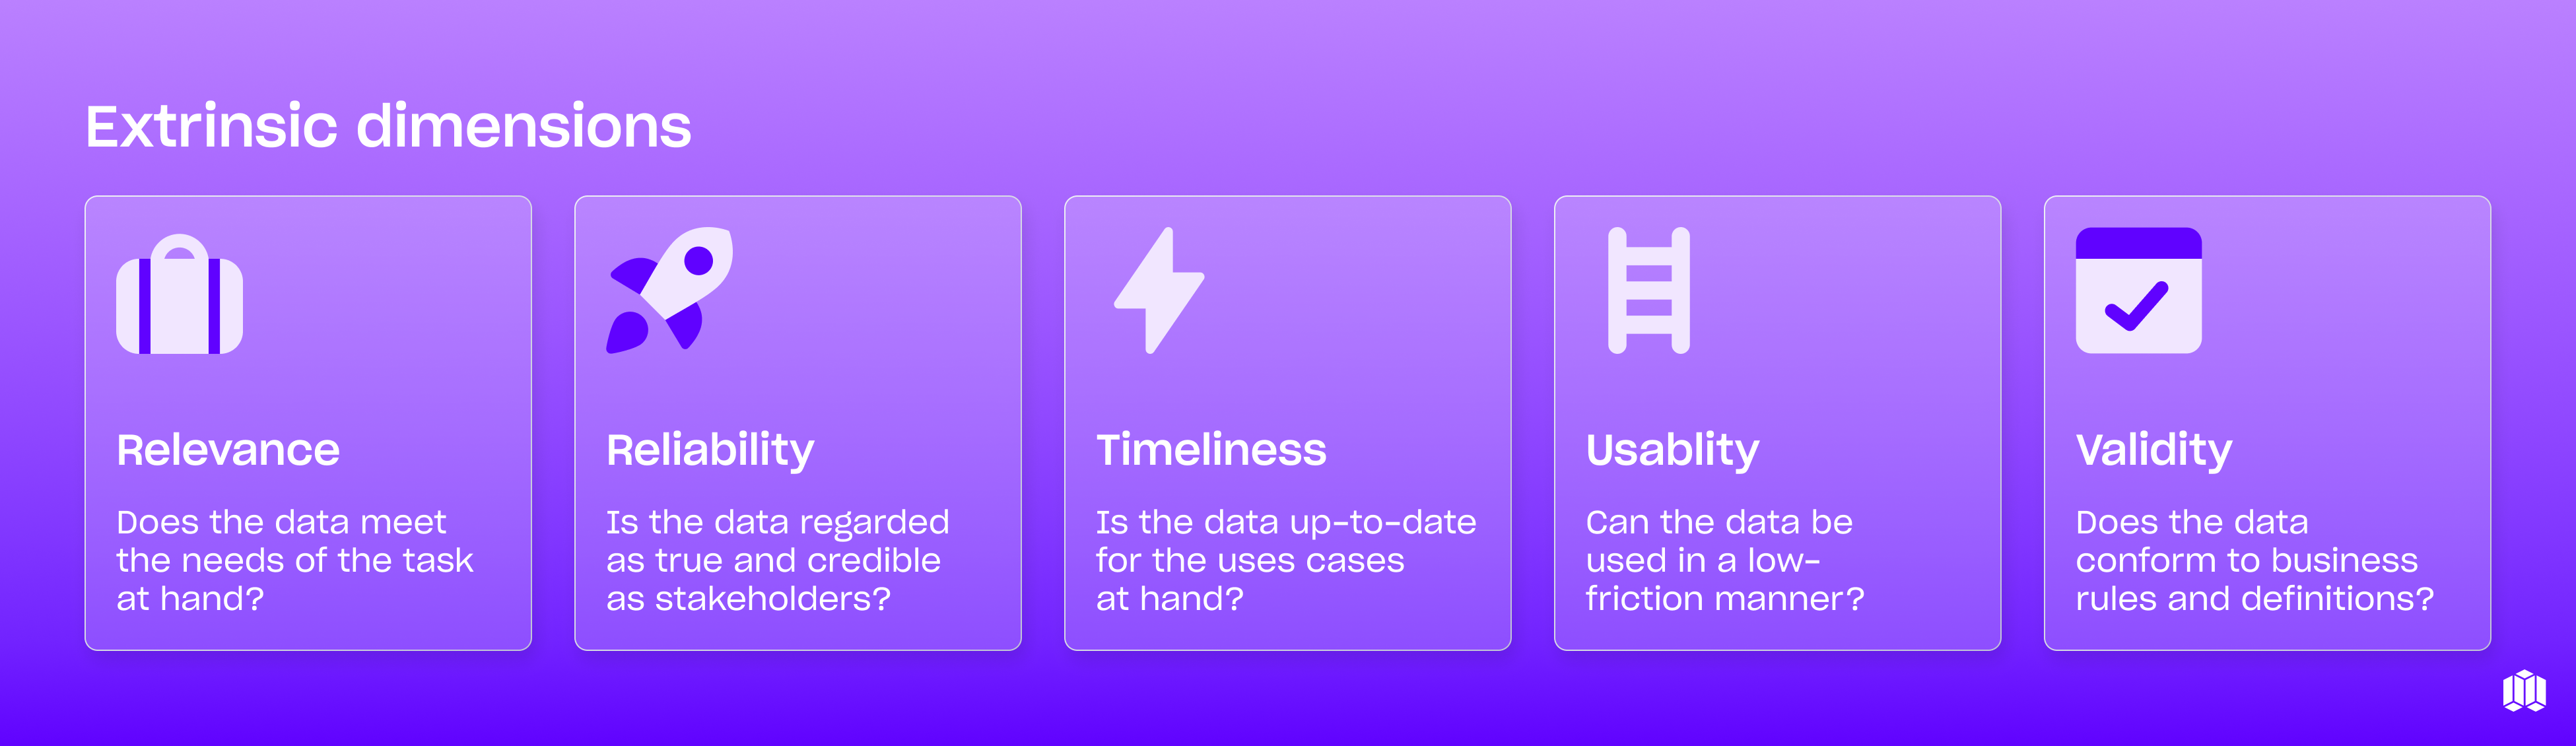
Extrinsic dimensions:
- Data relevance: Does the data meet the needs of the task at hand? Different business questions require different data points.
- Data reliability: Is the data regarded as true and credible by stakeholders? Trust is essential for data-driven decision making.
- Data timeliness: Is the data available when needed for the use cases at hand? Even perfect data is useless if it arrives too late.
- Data usability: Can the data be used in a low-friction manner? Data that's difficult to access or understand won't drive value.
- Data validity: Does the data conform to business rules and definitions? Each organization has its own standards for what constitutes valid data.
The key idea is that data quality is an outcome: it describes the condition of your data. A data set with high accuracy, completeness, and so on is high quality. Achieving this quality involves a mix of processes: data cleansing, validation checks, governance policies, and good old-fashioned discipline in how data is entered and managed.
It’s a proactive goal (you want data to be good by design), but in practice, many teams end up reacting to problems—finding out about issues only after a report breaks or a stakeholder flags something.
What is data observability?
Enter data observability. In the modern data tooling context, data observability applies the idea of application observability (monitoring and alerting) to data systems.
One helpful definition is that data observability is the degree of visibility you have into your data at any point in time. It’s about being able to understand the health and behavior of your data pipelines and databases in real-time, and to detect anomalies before they become full-blown problems.
Dedicated data observability tools (like Metaplane and others) work by continuously collecting metadata about your data ecosystem—things like row counts, table schemas, job execution logs, data freshness timestamps, and even statistical profiles of data values. They then monitor all that metadata for unusual changes and surface alerts when something seems off.

Think of it as analytics for your analytics, because these tools analyze your data pipelines and datasets to tell you if your analytics (and the underlying data) are behaving as expected.
The four pillars of data observability
To make this concrete, data observability often involves tracking a core set of indicators (sometimes called the “pillars” of data observability) about your data:
• Metadata: External characteristics of data (e.g., freshness, volume, schema)
• Lineage: Dependencies between data (e.g., deviation of one column from another)
• Logs: Interactions between data and the real world (e.g., ingestion, transformation, consumption)
• Metrics: Internal characteristics of data (e.g., distribution, nullness)

For example, if a data pipeline suddenly delivers significantly fewer rows than usual for a key table, a good observability platform will immediately flag the anomaly. This early warning allows data engineers to investigate and fix the issue (or at least escalate it) before it wreaks havoc on business decisions.
Crucially, data observability is continuous. Unlike traditional data quality checks that might run nightly or weekly, observability runs all the time in the background. When done well, it means no more blind spots: you have dashboards and alerts showing the pulse of your data pipelines, akin to how an SRE team monitors application uptime and performance. It flips data reliability from reactive firefighting to proactive monitoring practice.
Data observability as part of data quality
So how do these two concepts relate? The main thing to understand is that data observability is not a replacement for data quality – it’s a way to achieve and maintain data quality.
Think of data quality as the what and data observability as the how. You (and your stakeholders) decide what “good data” looks like – for example, no null customer IDs, sales figures updated by 6 AM daily, at most 1% variance in daily record counts, etc. These expectations are your data quality standards. Data observability then acts as the watchdog to ensure those expectations are being met continuously.
A simple three-step relationship often applies :
1. Define data quality expectations: e.g. “Orders table should be updated daily by 7AM and never have empty order_id fields.”
2. Monitor with data observability: Set up monitors/alerts on those conditions (alert if the orders table hasn’t updated by 7AM, or if null IDs exceed 0).
3. Respond and remediate: If an observability alert flags a potential issue (e.g. it’s 7:30AM and the table didn’t load), the data team investigates and fixes the root cause before it turns into a bigger problem.
By following this loop, observability becomes a layer within your data quality strategy. It’s the early warning system that signals when your data might be straying from the defined quality bar. This is why modern data teams invest heavily in observability: it serves as an automated nervous system for data reliability.
Data observability won't be your only data quality tool, and it doesn’t magically solve every problem on its own. You still need good processes and people to maintain quality. For example, you might prevent a lot of issues by implementing data testing in your ETL/ELT code (assertions in dbt, dbt-expectations tests, etc.), or by establishing clear data governance policies.
Observability complements these efforts by catching the issues that slip through and providing visibility. In short, observability doesn’t replace diligence in data engineering—it augments it.
Data observability vs data quality: Key differences
To solidify the distinction, let’s compare data quality vs. data observability directly on a few points:
Data quality describes the condition of your data, observability describes a set of practices
Data quality describes the condition of data (good or bad) relative to requirements. It’s essentially a problem space (addressing the question: “Is our data meeting the needs?”).
Data observability describes a set of practices and tools to monitor data systems. It’s a solution space—specifically about how to detect and resolve data issues.
Data quality is a goal, data observability is a method
Organizations care about data quality as an end goal—nobody wakes up excited about “observability” itself, they just don’t want bad data in production. Observability is a means of achieving reliable, high-quality data by watching for problems proactively.
Data quality is broader in scope
Data quality management is broad, encompassing everything from data entry standards to cleaning, governance, and remediation. Data observability has a narrower focus: it deals with monitoring and surfacing issues in data pipelines and databases. For example, improving data quality might involve a project to de-duplicate customer records or fill in missing values, whereas data observability would be the system that alerts you that duplicates or missing values have suddenly spiked today.
Data observability is proactive
Traditional data quality checks often happen after the fact (e.g. QA checks that run after data is loaded, or analysts noticing something off). Data observability enables a more proactive stance by detecting issues in real time or near-real-time. Instead of waiting for a user to report an error, the system tells you first. This drastically lowers the time to detection and resolution of data issues.
Data quality ensures periodic validation, data observability is continuous
Data observability platforms continuously monitor your data’s health. In contrast, you might ensure data quality at specific points in time (like at the end of an ETL job or during a weekly data review). Observability provides an always-on view.
Data observability's output is alerts of anomalies, quality's output is good or bad data
If data quality is lacking, the “output” is often a broken report or an angry email about incorrect data. With data observability, the output is an alert or anomaly report pointing to a potential issue (for example, a notification that “Table X’s row count is 30% lower than its 30-day average today”). In other words, observability produces actionable signals that something might be wrong, so you can investigate.
Data observability goes beyond just data quality
While improving data quality is a primary use of observability, a modern observability tool often provides insights beyond just quality errors.
It can help with root cause analysis (tracing an issue to an upstream source via lineage), impact analysis (figuring out which downstream reports or models will be affected by an upstream change or incident), cost monitoring (alerting on unusual spikes in data storage or query volume), and usage analytics (identifying unused tables or dashboards).

Data quality is the target state (high quality, trustworthy data) and also the discipline of achieving that state, while data observability is one of the modern tactics to maintain that state at scale. They work in tandem: you set quality criteria and improve your pipelines (classic data quality work), and you use observability tools to watch those pipelines and data like a hawk so you can address issues quickly.
Data observability for data engineers
Data observability is critical for data teams, as it enables them to monitor and understand the health and performance of data pipelines and systems in real-time. Data engineers can use data observability tools and platforms to:
- Monitor data pipelines and systems: Data observability tools provide continuous monitoring of data pipelines, allowing data engineers to keep an eye on data flows and system performance. This real-time visibility helps in quickly identifying any irregularities or potential issues.
- Detect data quality issues: By tracking key indicators such as data freshness, volume, and schema changes, data observability tools can detect data quality issues before they impact business outcomes. Early detection allows data engineers to address problems promptly, ensuring data reliability.
- Identify root causes: When data issues arise, data observability tools offer detailed insights that help data engineers trace the root cause. This capability is crucial for resolving issues quickly and preventing them from recurring.
- Ensure data reliability: Continuous monitoring and real-time alerts provided by data observability tools help maintain data reliability. Data engineers can ensure that data remains accurate, complete, and trustworthy, which is essential for making informed business decisions.
- Improve operational efficiency: By automating the monitoring process and providing actionable insights, data observability tools reduce the manual effort required to maintain data quality. This efficiency allows data engineers to focus on more strategic tasks, improving overall productivity.
Incorporating data observability into their workflow enables data engineers to proactively manage data quality and ensure the reliability of their data systems.
Ensuring data integrity through data quality and observability
Data integrity is critical for ensuring that data is accurate, reliable, and trustworthy. Data quality and observability are two essential components of ensuring data integrity.
Data quality ensures that data is correct, complete, and reliable for its intended use. This involves implementing processes and practices to maintain high standards of data accuracy, completeness, and consistency. Data quality practices include data cleansing, validation checks, and governance policies.
Data observability, on the other hand, provides real-time insights into the health and performance of data pipelines and systems. By continuously monitoring key indicators such as data freshness, volume, and schema changes, data observability tools can detect anomalies and surface alerts. This proactive approach helps in identifying and resolving data quality issues before they impact business outcomes.
By combining data quality and observability, organizations can ensure that their data is accurate, reliable, and trustworthy. Data quality practices set the standards for what good data looks like, while data observability tools monitor and maintain those standards in real-time. This synergy ensures that data integrity is upheld, enabling organizations to make confident, data-driven decisions.
Examples of data quality vs. data observability in action
Let’s make this even more concrete with a couple of scenarios that highlight the difference and interplay between data quality and data observability:
Scenario 1: Missing data in a pipeline
Imagine your ETL job failed last night, and as a result, your sales orders table didn’t get fully updated. This is a data quality issue (specifically, a completeness/timeliness issue – the data is incomplete and late).
Without observability, you might only discover the problem when a business user notices today’s sales numbers look abnormally low in the dashboard. That’s a bad day. With data observability in place, however, you would get an alert early in the morning that the table’s row count is, say, 50% lower than usual or that the ETL job didn’t run successfully.
The alert points out a potential quality issue (missing data) as soon as it happens, so you can jump in, identify the cause (maybe a broken dbt job or an API failure), and reload the data. The data quality issue (missing sales orders) is the problem; the observability alert is the mechanism that allowed you to catch and fix it promptly.
Scenario 2: Anomalous data values
Now suppose an upstream data source started logging temperatures in Fahrenheit instead of Celsius without anyone knowing. Downstream, your analytics assume the values are in Celsius. Suddenly all your temperature metrics are 2× larger than expected – a serious data accuracy/validity problem.
In a traditional setup, this might go unnoticed until an analyst or scientist spots the odd numbers (or worse, a decision is made on incorrect data). With data observability, your system could detect that the distribution of values in the temperature field has drifted far beyond historical norms (since Fahrenheit readings are much higher on average).
The observability tool would flag an anomaly on that dataset’s values. Your team gets alerted that “Hey, the data for temperature looks statistically very different today.” That clue helps you quickly trace upstream (perhaps using lineage tools) to find out that a unit change occurred. Again, data observability doesn’t fix the issue (you’d still need to adjust the data or pipeline), but it dramatically shortens the time it takes for data engineering to become aware of the data quality issue.
In both scenarios, the organization’s definition of data quality (e.g. “all records should be complete and within expected ranges”) was violated. Data observability is what enabled the team to detect those violations right away rather than much later.
The result: less data downtime (periods when data is unreliable) and less damage to trust. As a data practitioner, there’s huge value in that. It’s the difference between being proactive versus reactive. No one can prevent 100% of data issues—things will always break—but with observability, you can catch issues early and keep data quality on track.
Best practices for combining observability with data quality efforts
Knowing the theory is great, but how can you effectively integrate data observability into your data quality strategy? Here are some peer-to-peer tips to consider:
1. Define what “good data” means upfront
You can’t monitor what you haven’t specified. Take the time to define your critical data quality rules and expectations. Which tables/columns are most important, and what ranges or conditions should they satisfy? For example, decide that “`event_date` should never be in the future” or “daily active users shouldn’t drop more than 20% day-over-day”. These become the benchmarks that observability tools will watch.
2. Deploy observability on key data pipelines first:
Modern data observability platforms can connect to your warehouse and orchestration tools in minutes, but you don’t have to boil the ocean on day one. Identify a handful of your most business-critical data assets (the ones that would hurt the most if they went bad) and start monitoring those.
Set up alerts for freshness delays, volume anomalies, schema changes, etc., on those datasets. This targeted approach will give you quick wins and build confidence in the tooling and process.
3. Integrate alerts into your workflow
An observability tool is only as useful as the action it prompts. Make sure alerts reach the right people in a timely way – for instance, send notifications to your team’s Slack or PagerDuty.
Treat high-severity data alerts similar to how an SRE team treats infrastructure incidents. Have an on-call rotation if necessary, or at least clearly assign who investigates what. The faster you can respond, the less impact on downstream data quality.
4. Continue to implement data testing and governance
Observability isn’t a silver bullet that replaces all other data quality measures. Think of it as complementary. Still write unit tests for your data transformations (for example, use dbt tests or Great Expectations to validate assumptions in your pipelines). Still enforce good data governance and training so that data producers enter data correctly. Observability will catch what you don’t explicitly test for, and vice versa – together giving you more complete coverage.
5. Leverage observability insights for root cause analysis and prevention
When an observability alert does fire, use it as a learning opportunity. Most tools provide rich context (e.g. lineage showing upstream/downstream, or historical trends) to help diagnose the issue. Once you find the root cause, consider adding a new data quality check or process to prevent that class of issue in the future.
For instance, if you got alerted to a schema change that broke things, maybe implement a stricter process for schema changes (like notifications or contract tests). Over time, this creates a virtuous cycle where observability not only catches issues but helps you harden your data pipelines against future problems.
.png)
By combining these practices, your data quality efforts become much more robust. You’ll have both prevention (through testing, standards, and good pipeline design) and detection (through observability’s continuous monitoring). This layered approach is the key to building truly reliable data systems at scale.
Building a data platform for data quality and observability
Building a data platform for data quality and observability requires a comprehensive approach that includes:
- Data quality tools and platforms: Implement tools and platforms that ensure data accuracy, completeness, and reliability. These tools help in data cleansing, validation, and governance, ensuring that data meets the required quality standards.
- Data observability tools and platforms: Deploy data observability tools to provide real-time insights into data pipelines and systems. These tools continuously monitor data health, detect anomalies, and surface alerts, enabling proactive management of data quality.
- Data engineering practices: Adopt best practices in data engineering to ensure data reliability and trustworthiness. This includes designing robust data pipelines, implementing data testing, and following data governance policies.
- Data governance practices: Establish clear data governance practices to maintain data quality and integrity. This involves setting data standards, defining data ownership, and ensuring compliance with data policies.
- Data monitoring and testing: Continuously monitor and test data to ensure its quality and reliability. Implement automated data testing frameworks and regularly review data quality metrics to identify and address any issues.
By integrating these components, organizations can build a data platform that ensures high data quality and observability. This comprehensive approach enables data engineers to maintain reliable data systems, reduce the risk of data-related errors, and ensure that data remains accurate and trustworthy.
Conclusion
In the debate of “data quality vs. data observability,” the verdict is that it’s not an either/or choice at all – it’s both. Data quality is the ultimate goal: you want data that is accurate, complete, timely, and trustworthy so that your team can drive business value with confidence.
Data observability is a powerful approach to help you reach that goal by ensuring you have eyes on your data’s health at all times. Rather than viewing them as competitors, it’s best to see data observability as an integral part of your data quality toolkit.
Want to learn how data observability can boost your data quality? Try Metaplane for free, or book some time with our team for a personalized demo.
Table of contents
Tags


...


...


